Fig. 1
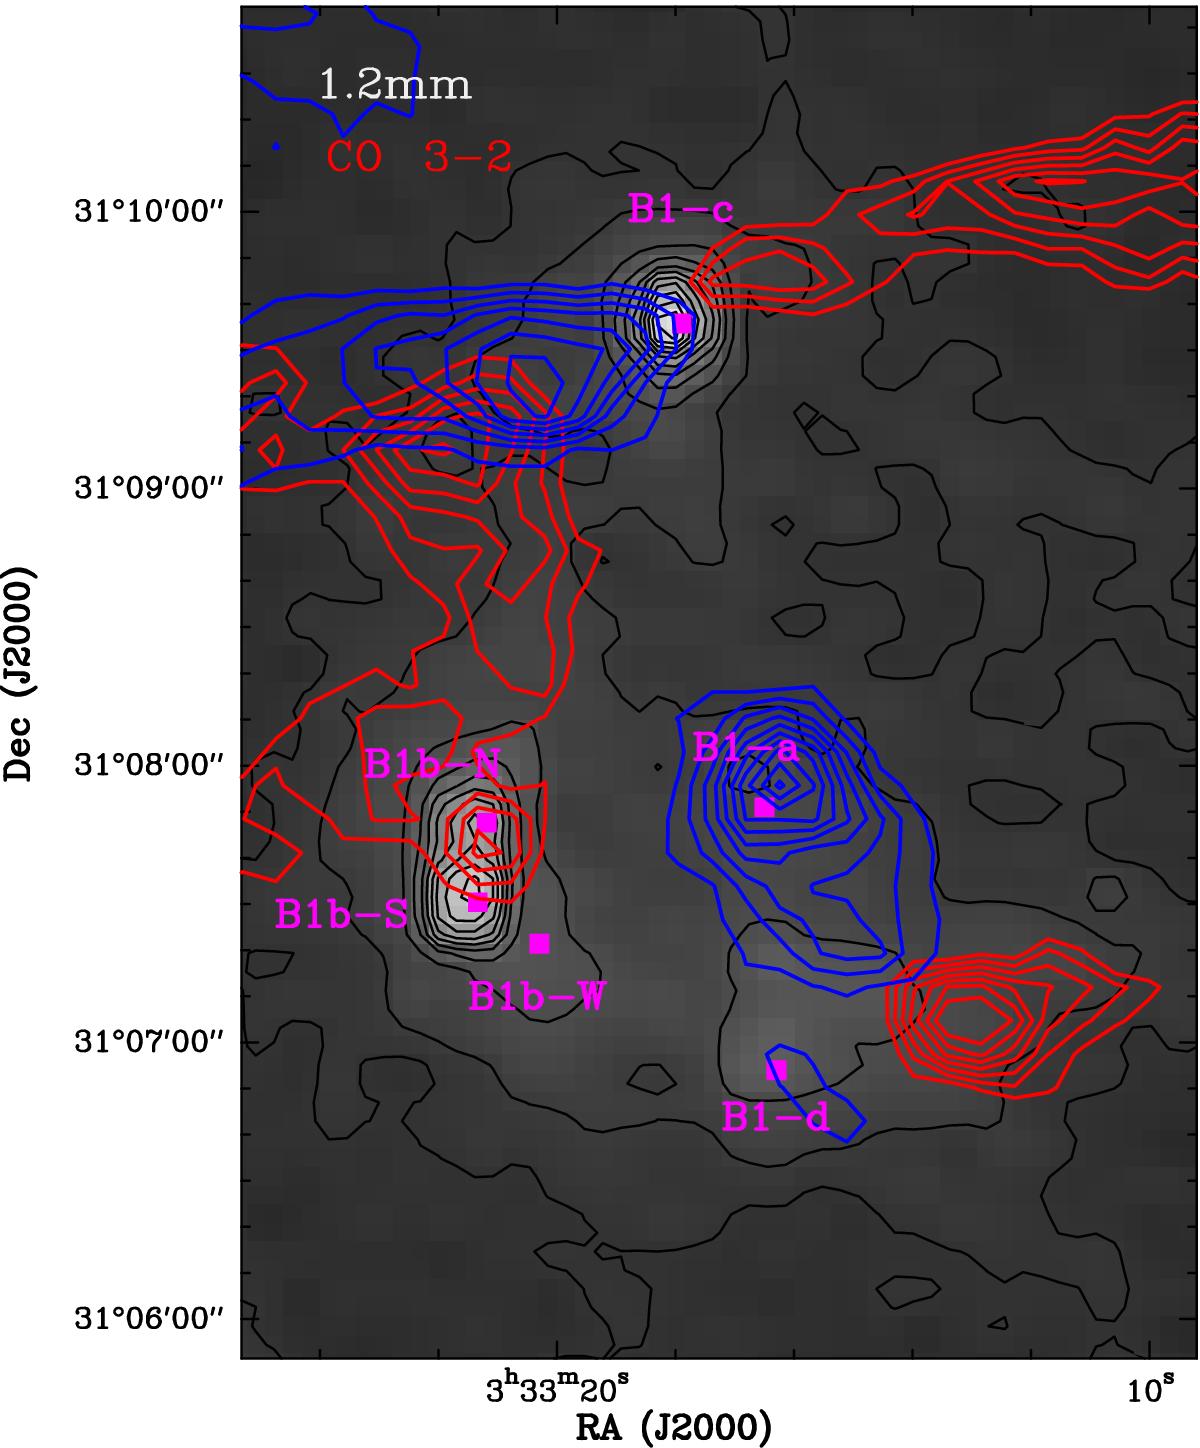
Continuum map at 1.2 mm observed at the IRAM telescope with the MAMBO instrument (Daniel et al. 2013). The contours are 20 mJy/beam and 40 mJy/beam to 400 mJy/beam in steps of 40 mJy/beam. Contours show the high velocity blue (2.5 to 4.5 km s-1) and red (8.5 to 11.5 km s-1) emission of the CO 3 → 2 line as observed with the JCMT (project S12AC01).
Current usage metrics show cumulative count of Article Views (full-text article views including HTML views, PDF and ePub downloads, according to the available data) and Abstracts Views on Vision4Press platform.
Data correspond to usage on the plateform after 2015. The current usage metrics is available 48-96 hours after online publication and is updated daily on week days.
Initial download of the metrics may take a while.