Fig. 4
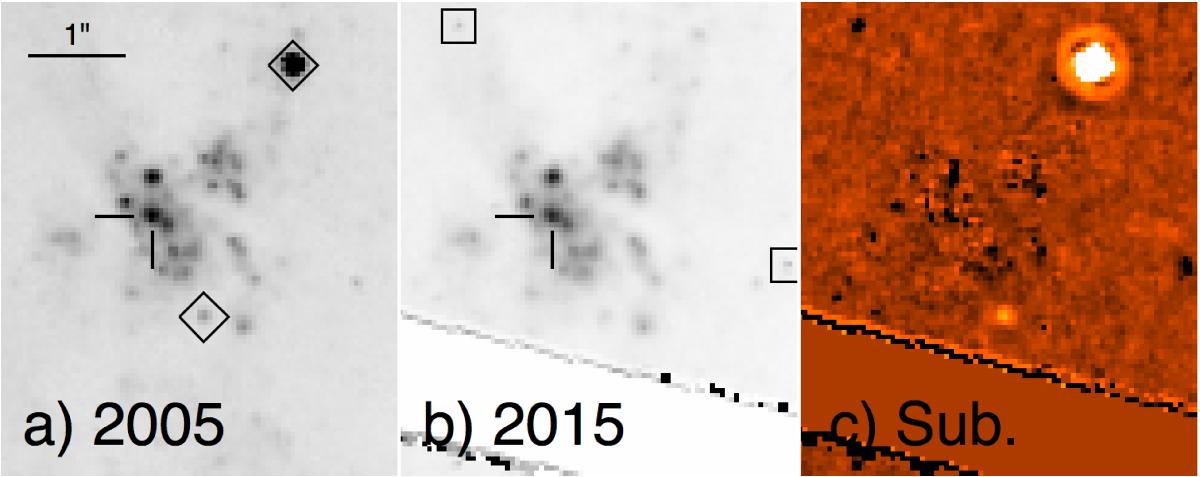
Difference imaging using HST data at the position of PTF12os. Panel a) shows the 2005 ACS F555W image, panel b) the 2015 WFC3 F555W image transformed to the same pixel grid as the 2005 image, and panel c) the difference image. Sources brighter in 2005 are indicated with diamonds in panel a) and appear brighter in the difference image. Sources brighter in 2015 are marked with squares in panel b) and appear darker in the difference image. North is up and east is left, and the scale is indicated in panel a). The diagonal band at the bottom of the 2015 image is the gap between the two WFC3 chips.
Current usage metrics show cumulative count of Article Views (full-text article views including HTML views, PDF and ePub downloads, according to the available data) and Abstracts Views on Vision4Press platform.
Data correspond to usage on the plateform after 2015. The current usage metrics is available 48-96 hours after online publication and is updated daily on week days.
Initial download of the metrics may take a while.