Fig. 2
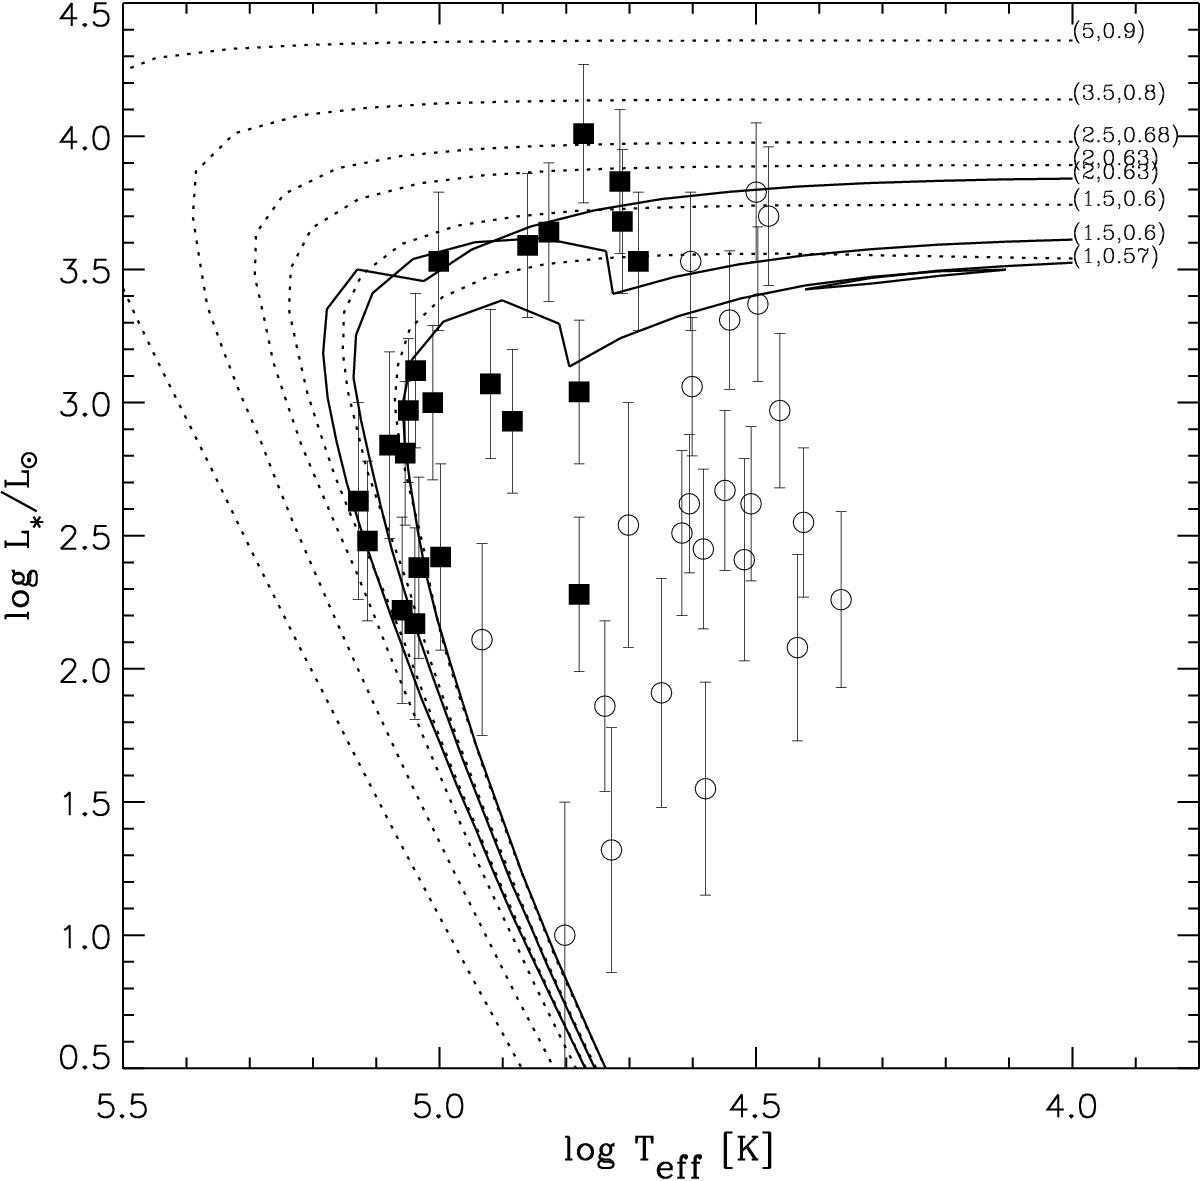
HR diagram showing the location of the CSs from this sample. Filled squares represent CSs with Teff determined from He ii and the empty circles indicate T(H i). Curves representing H- (dashed) and He-burning (solid) tracks for Z = 0.016 from Vassiliadis & Wood (1994) are also plotted, and labelled with the corresponding MS and post-AGB masses.
Current usage metrics show cumulative count of Article Views (full-text article views including HTML views, PDF and ePub downloads, according to the available data) and Abstracts Views on Vision4Press platform.
Data correspond to usage on the plateform after 2015. The current usage metrics is available 48-96 hours after online publication and is updated daily on week days.
Initial download of the metrics may take a while.