Fig. 1
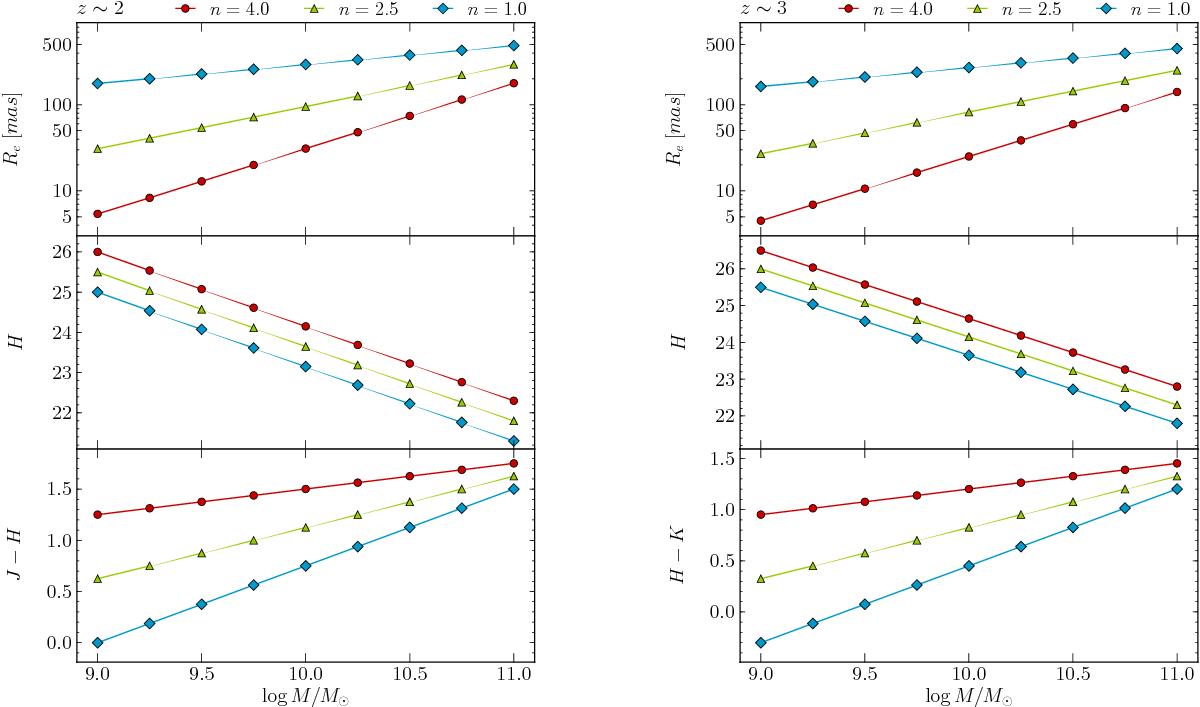
Structural and photometric parameters adopted for the two sets of simulated galaxies at z = 2 (left panels) and z = 3 (right panels). For each set we plot the relation between the galaxy mass and effective radii in milli-arcseconds (top panel), magnitude (middle panel), and colour (bottom panel) for the 9 template galaxies. In each panel we show the scaling relations for galaxies with 3 different Sersic index with different colours and symbols (see the legend on top of the figure).
Current usage metrics show cumulative count of Article Views (full-text article views including HTML views, PDF and ePub downloads, according to the available data) and Abstracts Views on Vision4Press platform.
Data correspond to usage on the plateform after 2015. The current usage metrics is available 48-96 hours after online publication and is updated daily on week days.
Initial download of the metrics may take a while.