Fig. 9
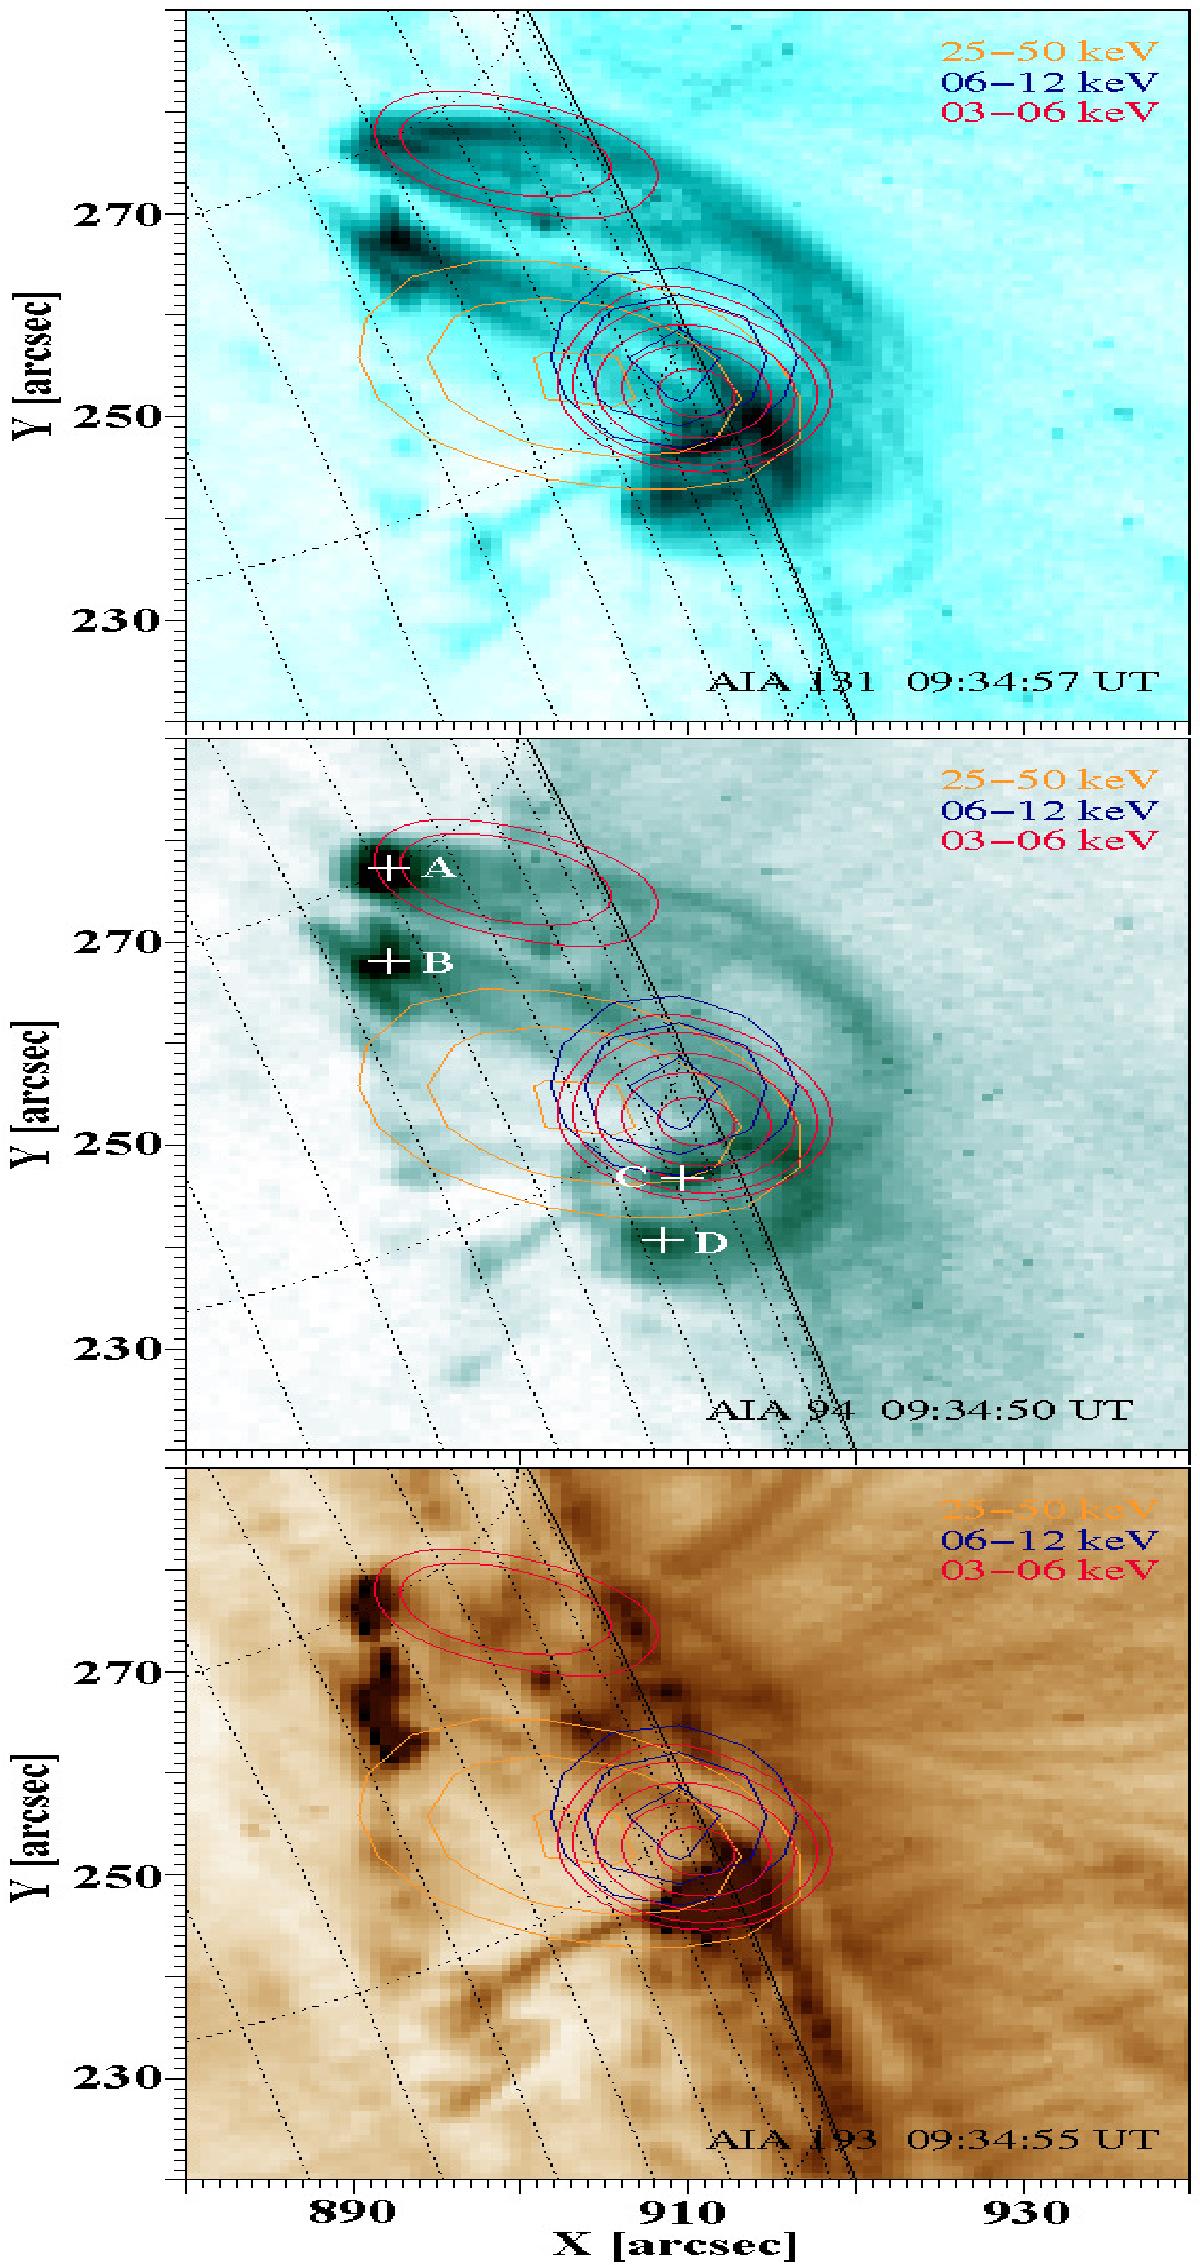
Individual loops observed by SDO/AIA in channels 131, 94, and 193 Å at 9:34 UT processed with the NAFE method. Each panel is overlaid by RHESSI X-ray sources in different energy bands shown as contours: 03−06 keV (in red), 06−12 keV (in blue), and 25−50 keV (in yellow). The integration time was 9:34:00−9:35:00 UT for the 3−6 keV band and 9:34:20−9:35:00 UT for the 6−12 and 25−50 keV bands. Individual contours are displayed for 65, 82, and 98% (25−50 keV band), 79, 87, and 95% (6−12 keV band), and for 47, 56, 69, 82, and 95% (3−6 keV band) of maxima in their intensity. Loop footpoints are marked by crosses A−D in middle panel.
Current usage metrics show cumulative count of Article Views (full-text article views including HTML views, PDF and ePub downloads, according to the available data) and Abstracts Views on Vision4Press platform.
Data correspond to usage on the plateform after 2015. The current usage metrics is available 48-96 hours after online publication and is updated daily on week days.
Initial download of the metrics may take a while.