Fig. 7
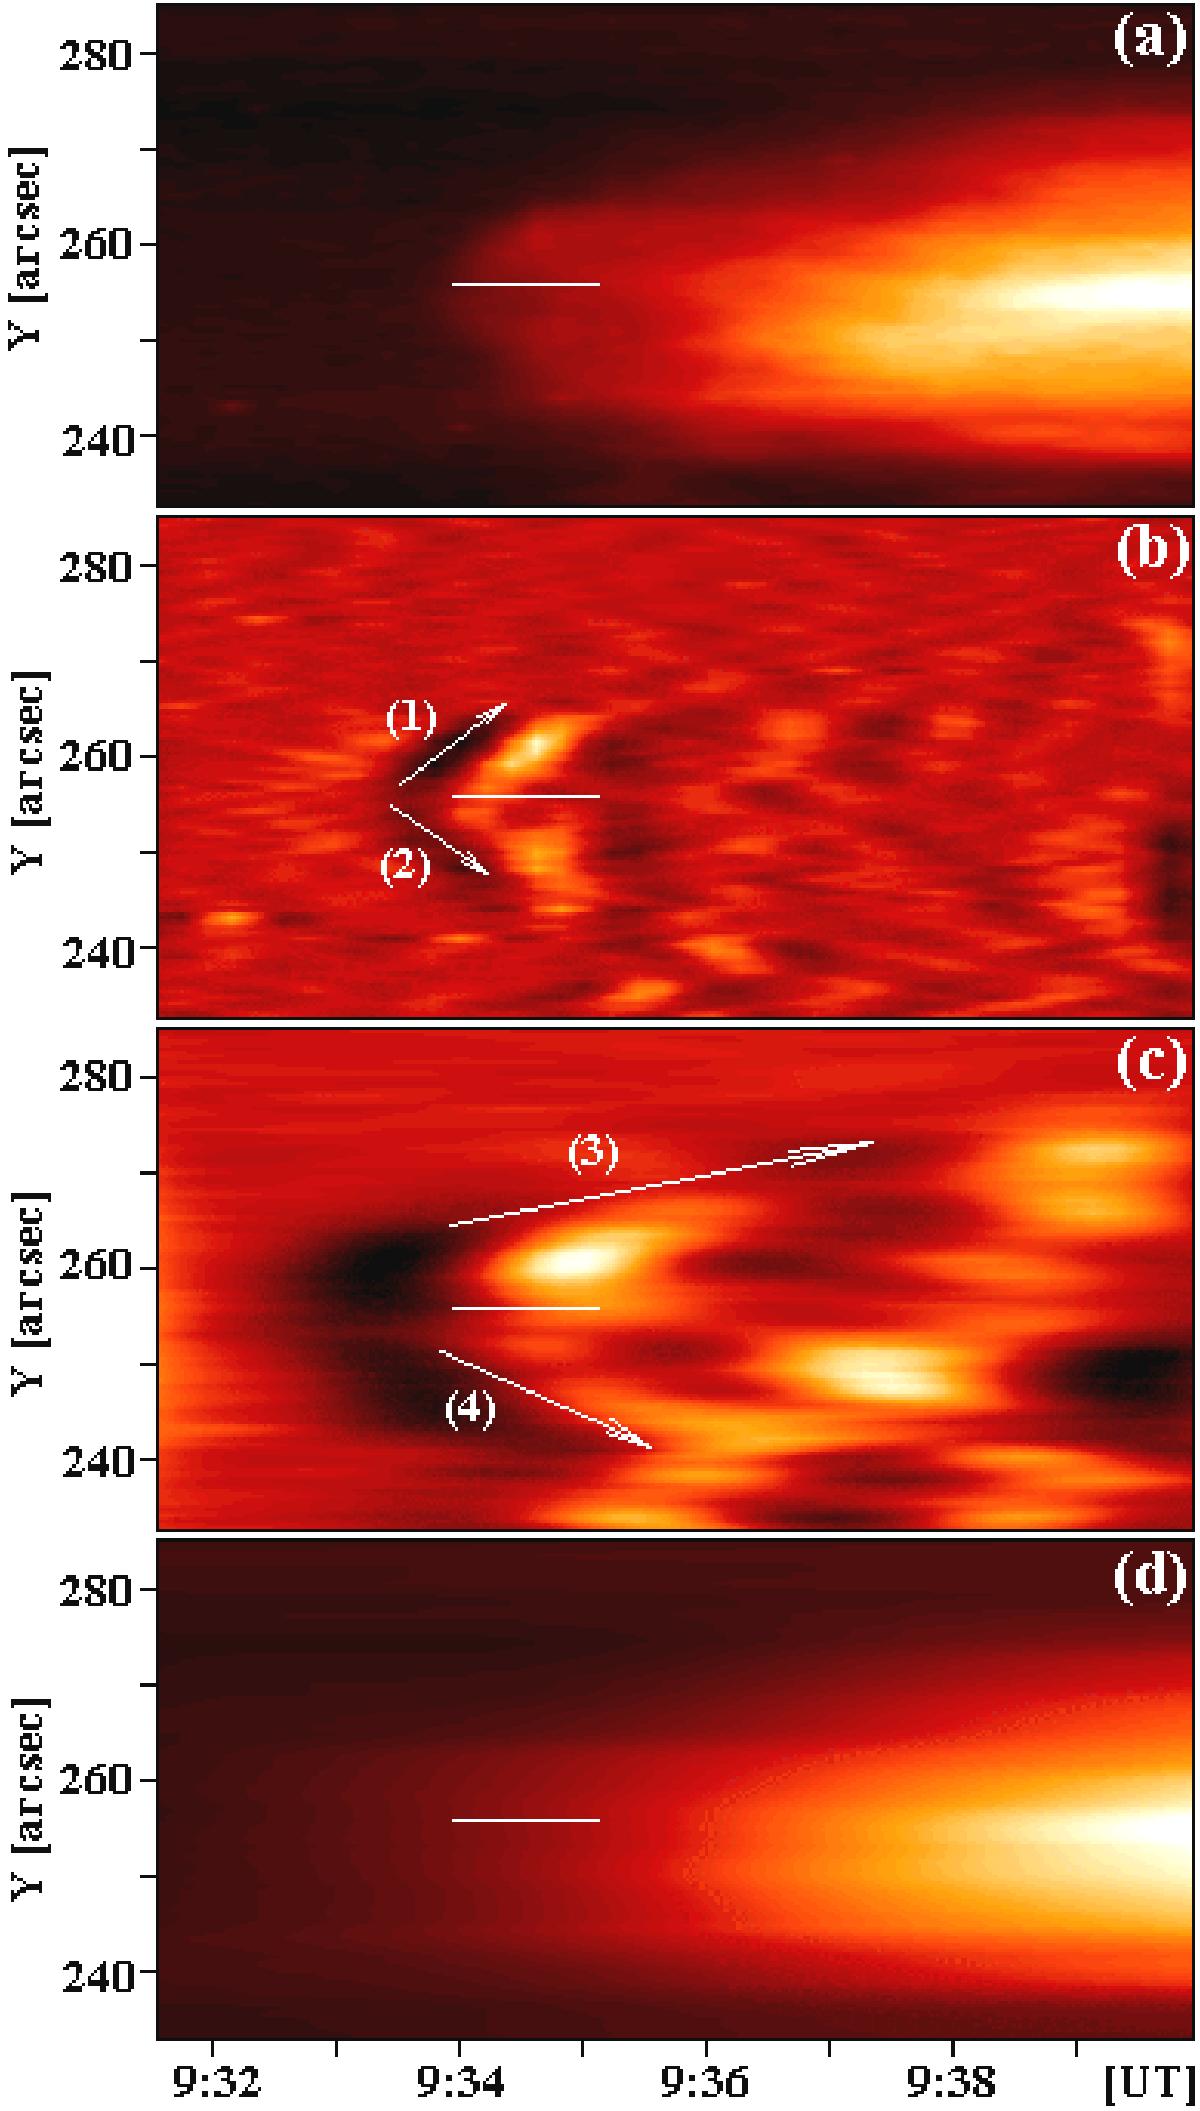
Example of time-slit diagram (9:31:33−9:39:57 UT) for the SDO/AIA 131 Å channel and slit at position X = 921 arcsec/Y = 233−286 arcsec. Panel a): original time-slice diagram. Separated time structures according to their characteristic temporal scales 42−120 s, 120−348 s, and >348 s are shown in panels b), c), and d), respectively. The position (Y = 256 arcsec) and radio source time interval (9:33:57−9:35:07 UT) is presented by the horizontal solid line in individual panels. Individual arrows mark detected EUV flows propagating in the loop area. Estimated velocities are 117, 109, 30, and 70 km s-1 for arrows 1, 2, 3, and 4, respectively.
Current usage metrics show cumulative count of Article Views (full-text article views including HTML views, PDF and ePub downloads, according to the available data) and Abstracts Views on Vision4Press platform.
Data correspond to usage on the plateform after 2015. The current usage metrics is available 48-96 hours after online publication and is updated daily on week days.
Initial download of the metrics may take a while.