Fig. 6
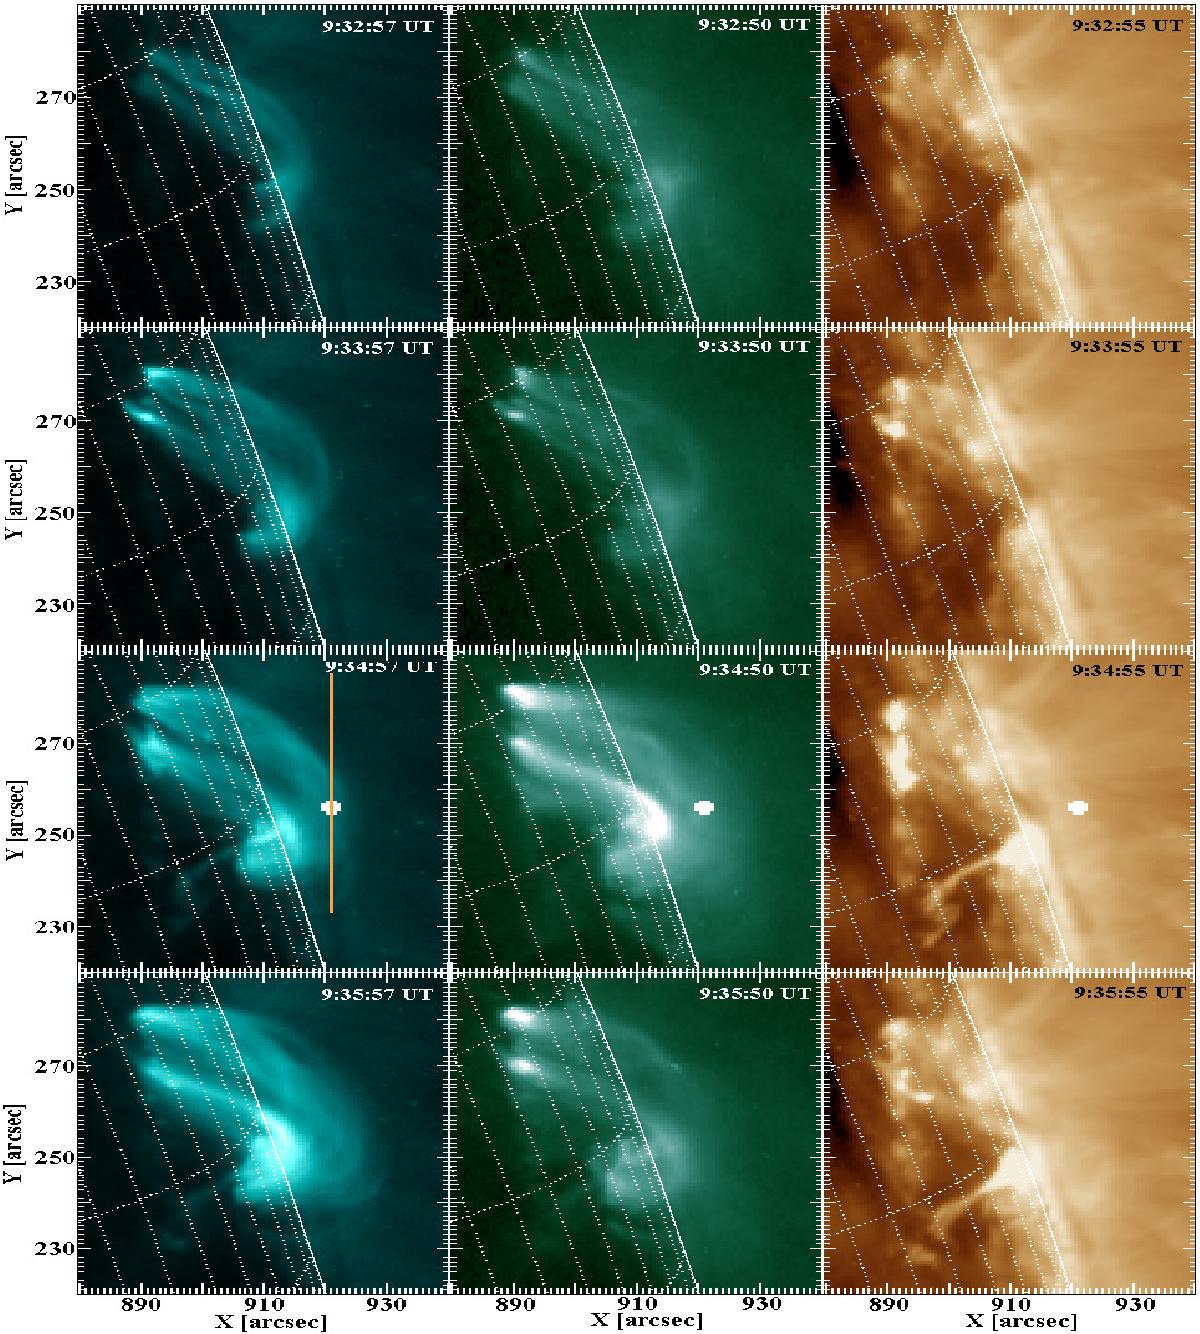
Time evolution (9:32−9:35 UT) of expanding loops observed by SDO/AIA in channels 131 Å (left column), 94 Å (middle column), and 193 Å (right column). The location of the radio source at 5.7 GHz is indicated by a white blob at 9:34 UT (third row). An example of the slit position passing the radio source is shown by an orange vertical solid line in the left column (131 Å) for the 9:34:57 UT panel.
Current usage metrics show cumulative count of Article Views (full-text article views including HTML views, PDF and ePub downloads, according to the available data) and Abstracts Views on Vision4Press platform.
Data correspond to usage on the plateform after 2015. The current usage metrics is available 48-96 hours after online publication and is updated daily on week days.
Initial download of the metrics may take a while.