Fig. 5
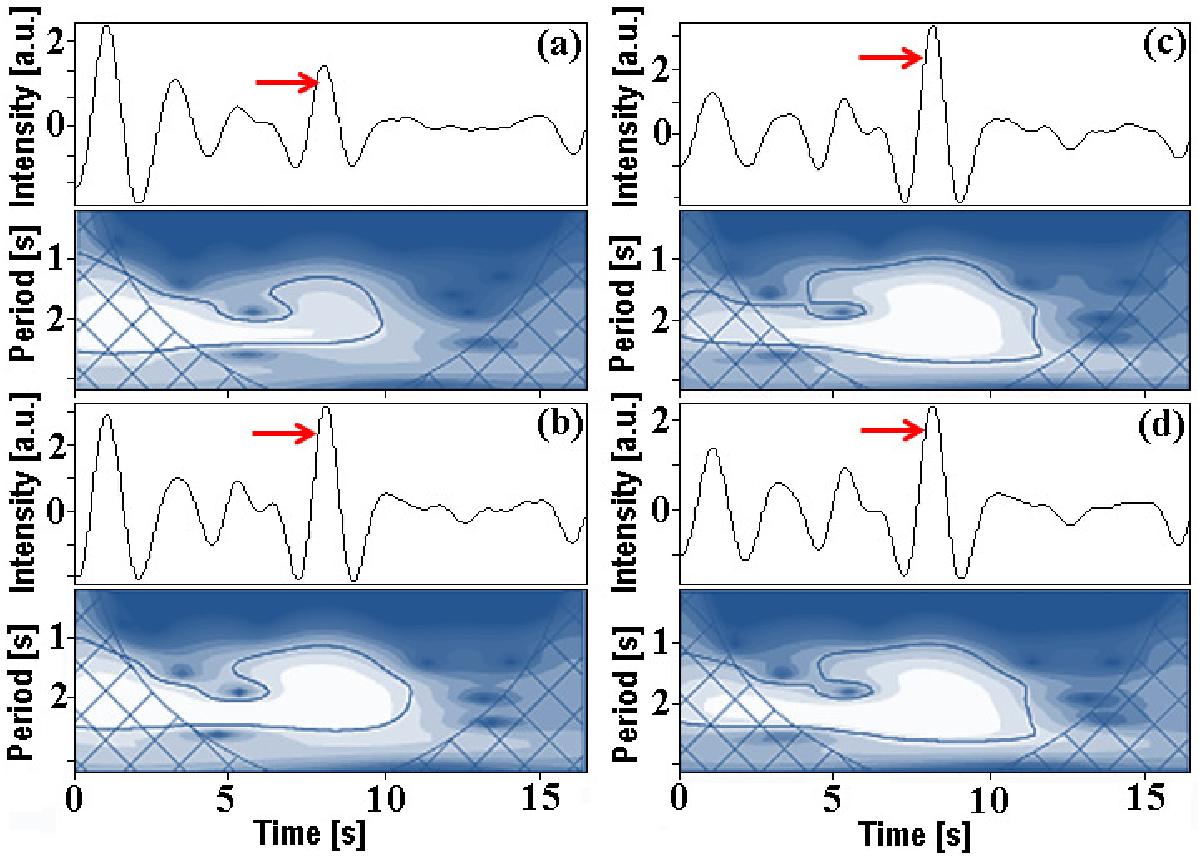
Selected time series of separated radio dynamic spectrum in panel 2a (Fig. 2) and the wavelet tadpole patterns with a characteristic period P ≈ 2 s. These time series (9:34:51−9:35:07 UT) observed at frequencies 5026 (panel a)), 5398 (panel b)), 5579 (panel c)), and 6593 MHz (panel d)) show their peak maxima (red arrows) equal to the maxima of the wavelet tadpole heads. There is no measurable frequency drift of these tadpole head maxima.
Current usage metrics show cumulative count of Article Views (full-text article views including HTML views, PDF and ePub downloads, according to the available data) and Abstracts Views on Vision4Press platform.
Data correspond to usage on the plateform after 2015. The current usage metrics is available 48-96 hours after online publication and is updated daily on week days.
Initial download of the metrics may take a while.