Fig. 2
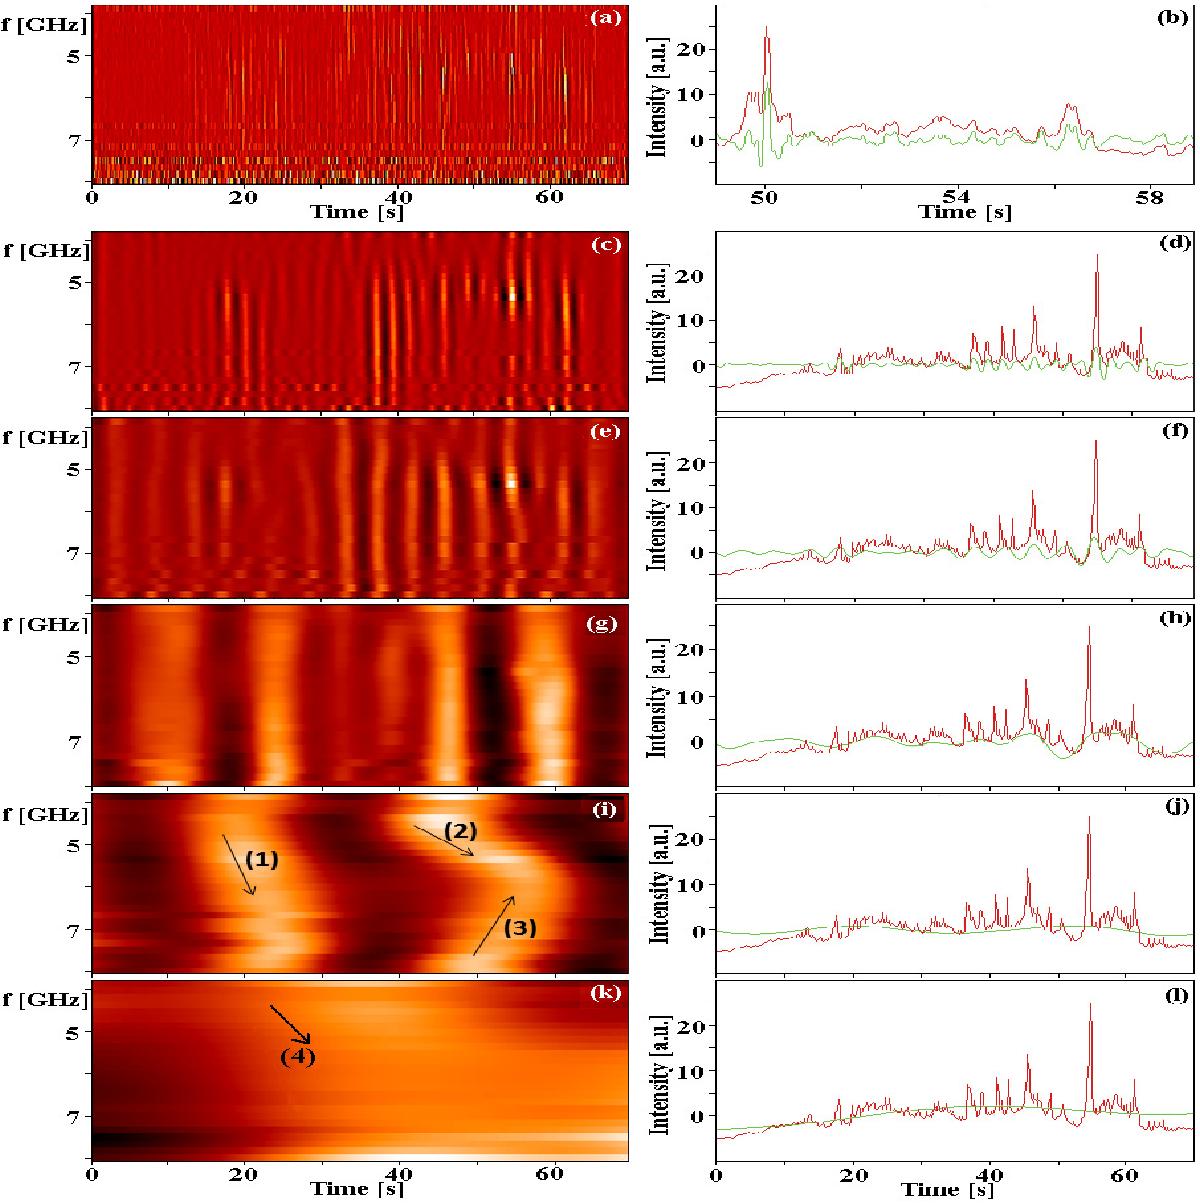
Dynamic spectra of separated bursts (left panels) and their selected time series (right panels). Bursts are separated according to their characteristic period ranges of 0.07-1.49 s (panel a)), 1.49−3.03 s (panel c)), 3.03−5.83 s (panel e)), 5.83−21.54 s (panel g)), 21.54−40.26 s (panel i)), and for periods >40.26 s (panel k)). The positive and negative parts of the amplitudes (in relation to their mean values) are given in white and black, respectively (left panels). Frequency drifts of 520, 138, and −262 MHz s-1 as well as 158 MHz s-1 are marked by arrows in panel i (1, 2, and 3) and k (arrow 4). For a detailed comparison the individual peaks in the radio time series of the original radio dynamic spectrum (in red) and of the separated spectrum (in green) are shown for the selected 5194 MHz in the right panels. To show the fine individual peaks, we selected the time interval of 49−59 s (in panel b)) within the entire 70 s event duration.
Current usage metrics show cumulative count of Article Views (full-text article views including HTML views, PDF and ePub downloads, according to the available data) and Abstracts Views on Vision4Press platform.
Data correspond to usage on the plateform after 2015. The current usage metrics is available 48-96 hours after online publication and is updated daily on week days.
Initial download of the metrics may take a while.