Fig. 10
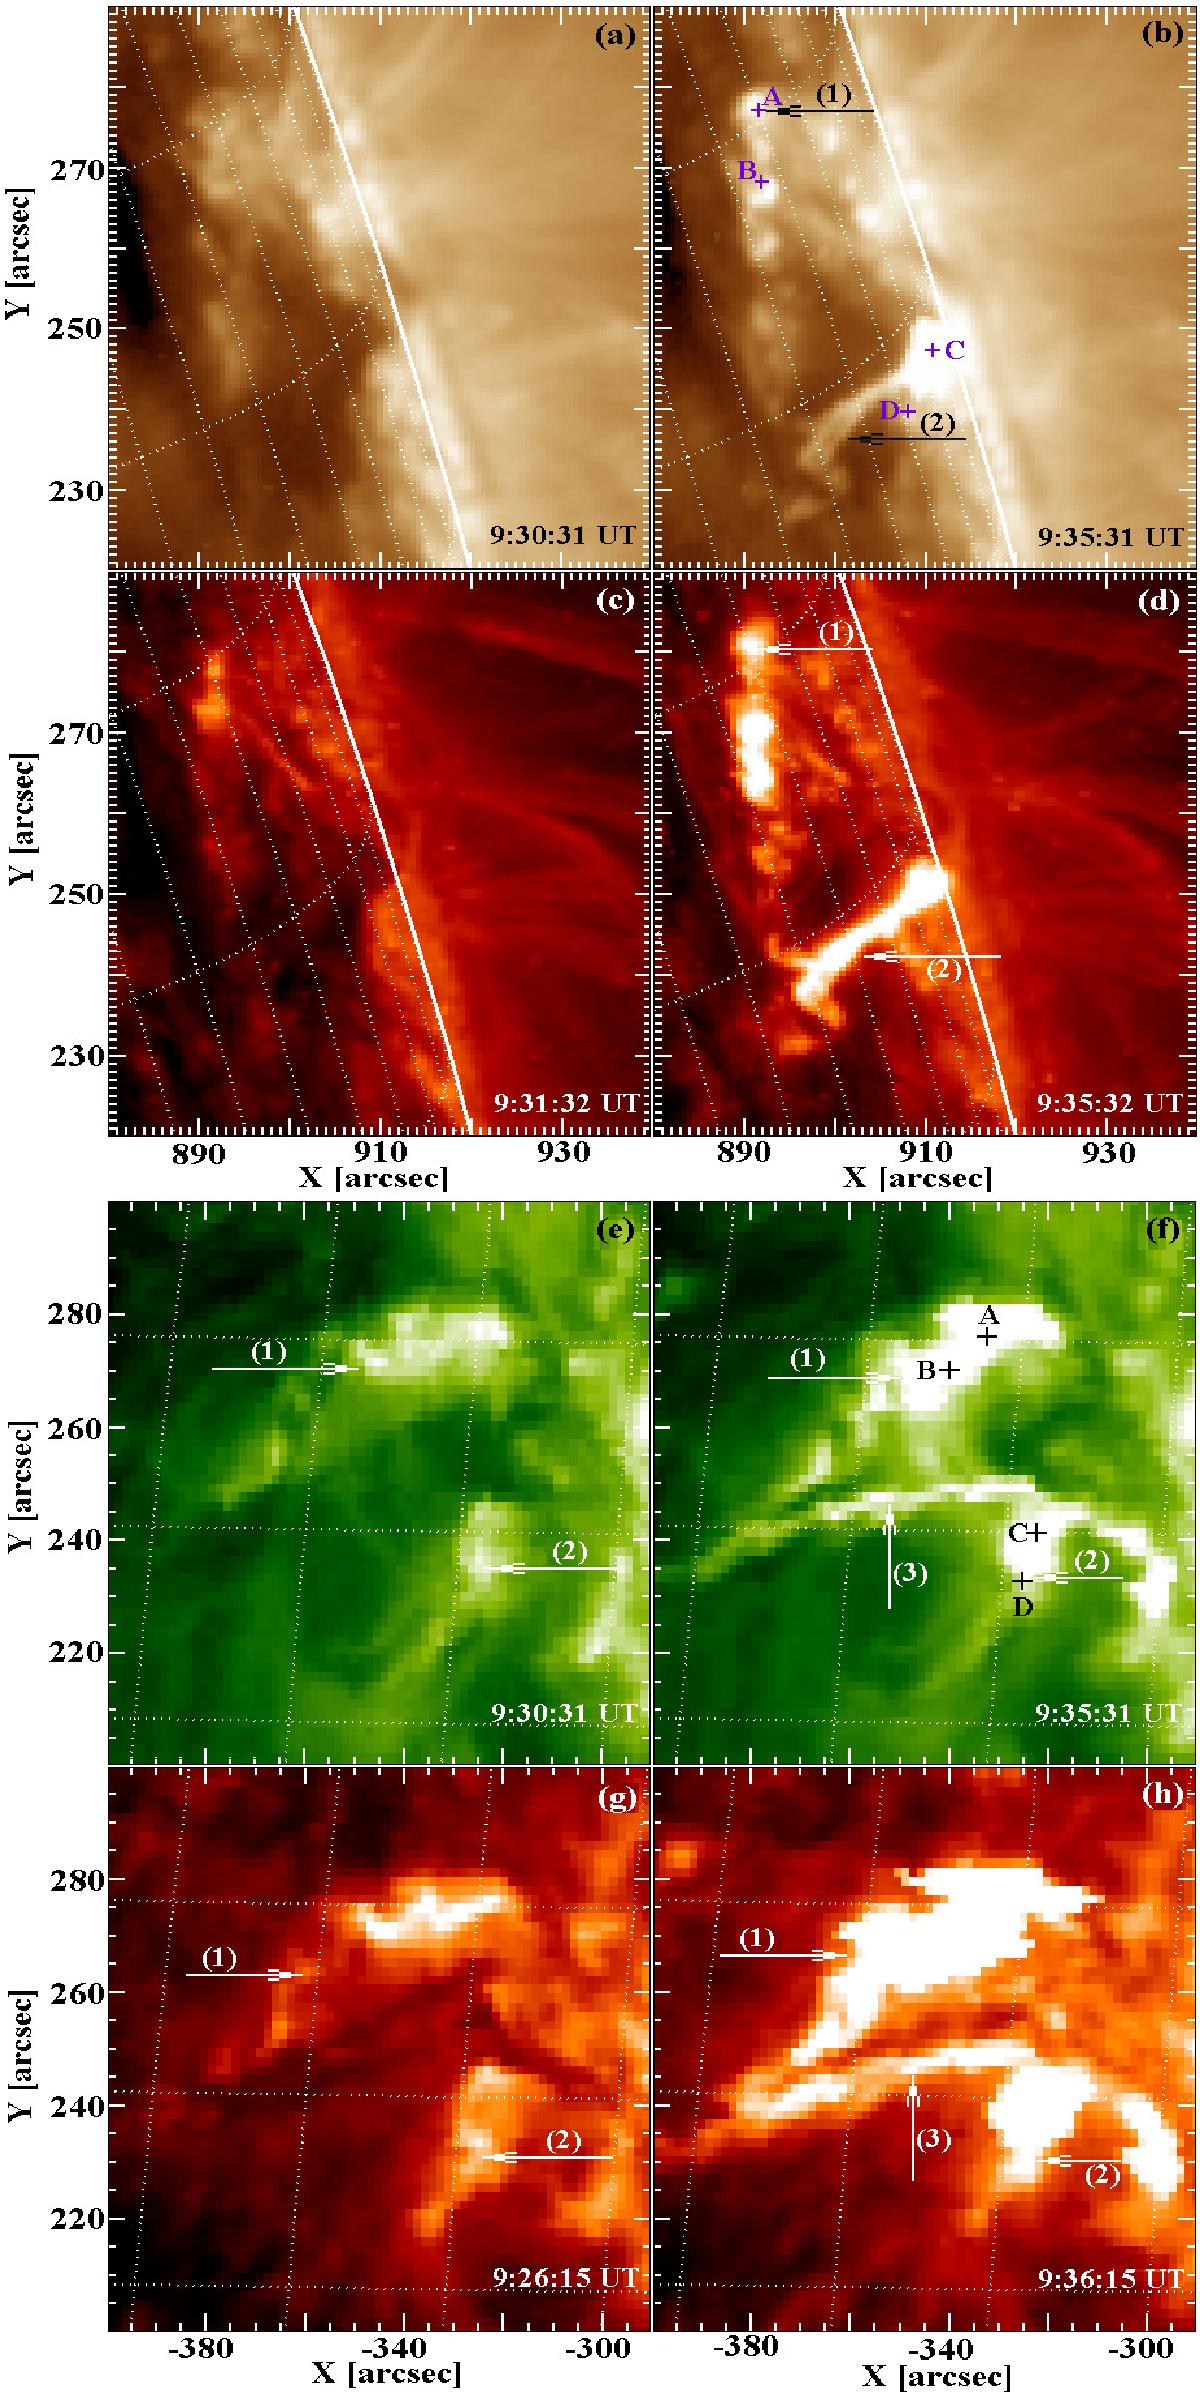
Time evolution of individual flare structures (footpoint ribbons) observed by SDO/AIA (panels a)−d)) and STEREO/SECCHI-EUVI (panels e)−h)). Observations are provided at channels 193 Å (panels a)−b)), 304 Å (panels c)−d)), 195 Å (panels e)−f)), and 304 Å (panels g)−h)). Panels in the left and right columns reflect the situation before (9:26−9:31 UT) and after (9:35−9:36 UT) formation of the new flare structure (arrow 3) that is visible between the older ones marked by arrows 1 and 2. Positions of individual loop footpoints (see middle panel in Fig. 9) are marked by crosses A−D in panels b) and f).
Current usage metrics show cumulative count of Article Views (full-text article views including HTML views, PDF and ePub downloads, according to the available data) and Abstracts Views on Vision4Press platform.
Data correspond to usage on the plateform after 2015. The current usage metrics is available 48-96 hours after online publication and is updated daily on week days.
Initial download of the metrics may take a while.