Fig. 1
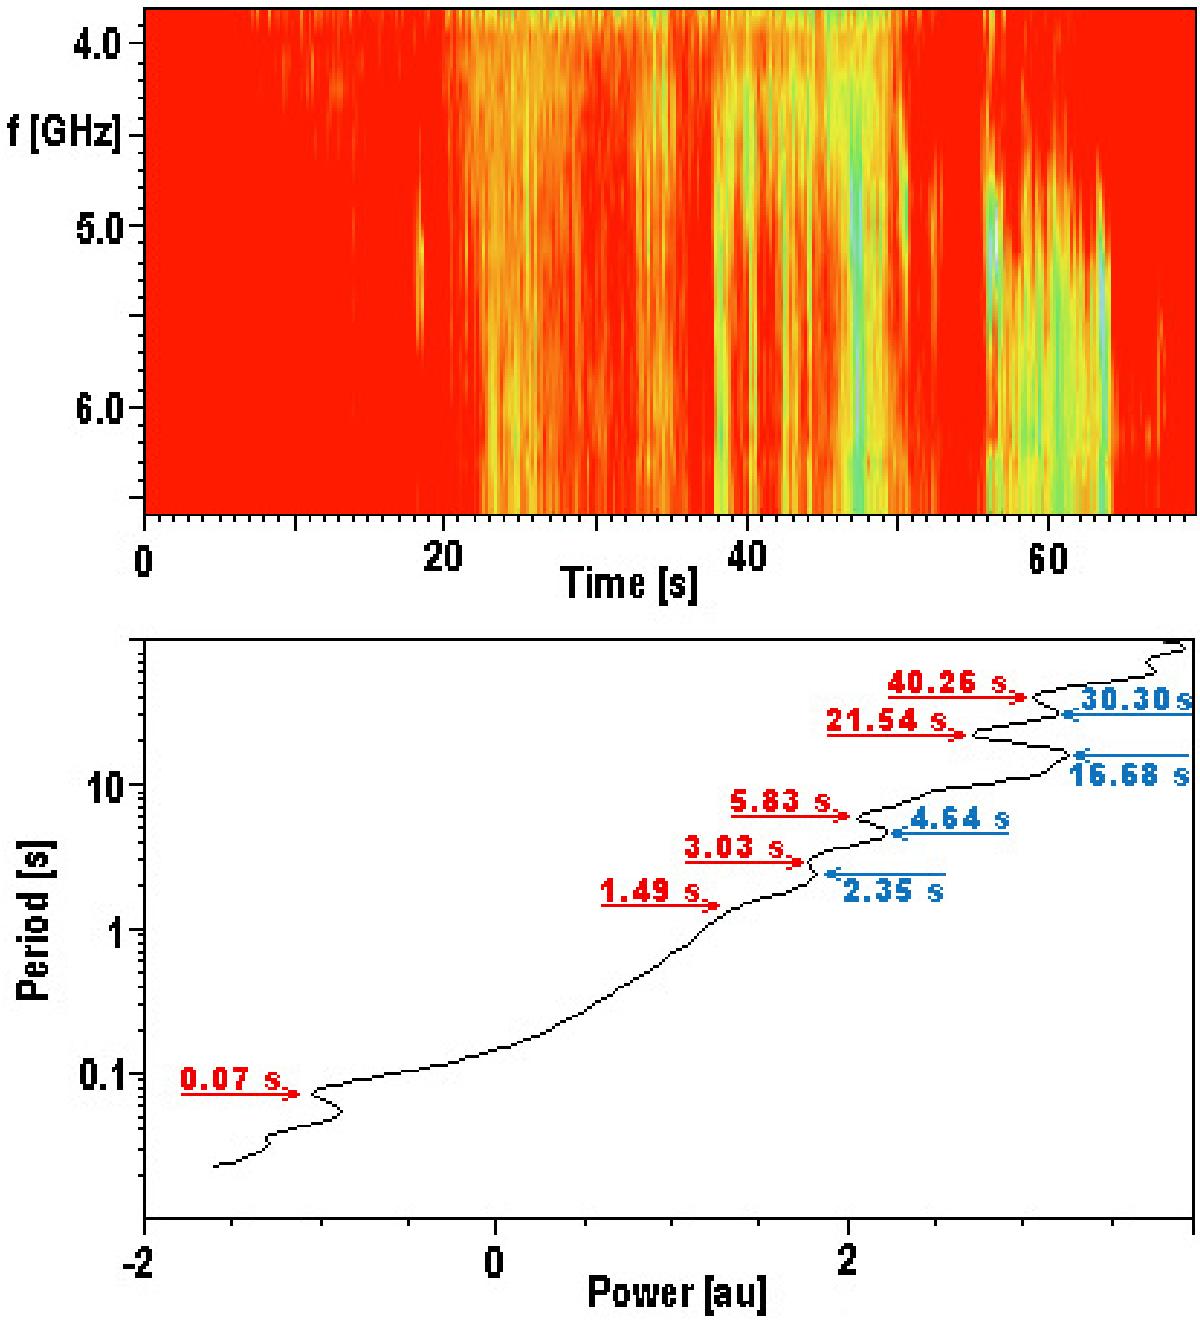
Top: original complex radio dynamic spectrum with broadband pulsations that lasted 70 s (9:33:57−9:35:07 UT) and was observed by the Badary Broadband Microwave Spectropolarimeter. Bottom: averaged global wavelet spectrum (AGWS) made from the spectrum in panel a) with strong peaks at periods P = 2.35, 4.64, 16.68, and 30.30 s (blue arrows) and with local minima at periods 0.07, 1.49, 3.03, 5.83, 21.54, and 40.26 s (red arrows).
Current usage metrics show cumulative count of Article Views (full-text article views including HTML views, PDF and ePub downloads, according to the available data) and Abstracts Views on Vision4Press platform.
Data correspond to usage on the plateform after 2015. The current usage metrics is available 48-96 hours after online publication and is updated daily on week days.
Initial download of the metrics may take a while.