Free Access
Fig. 9
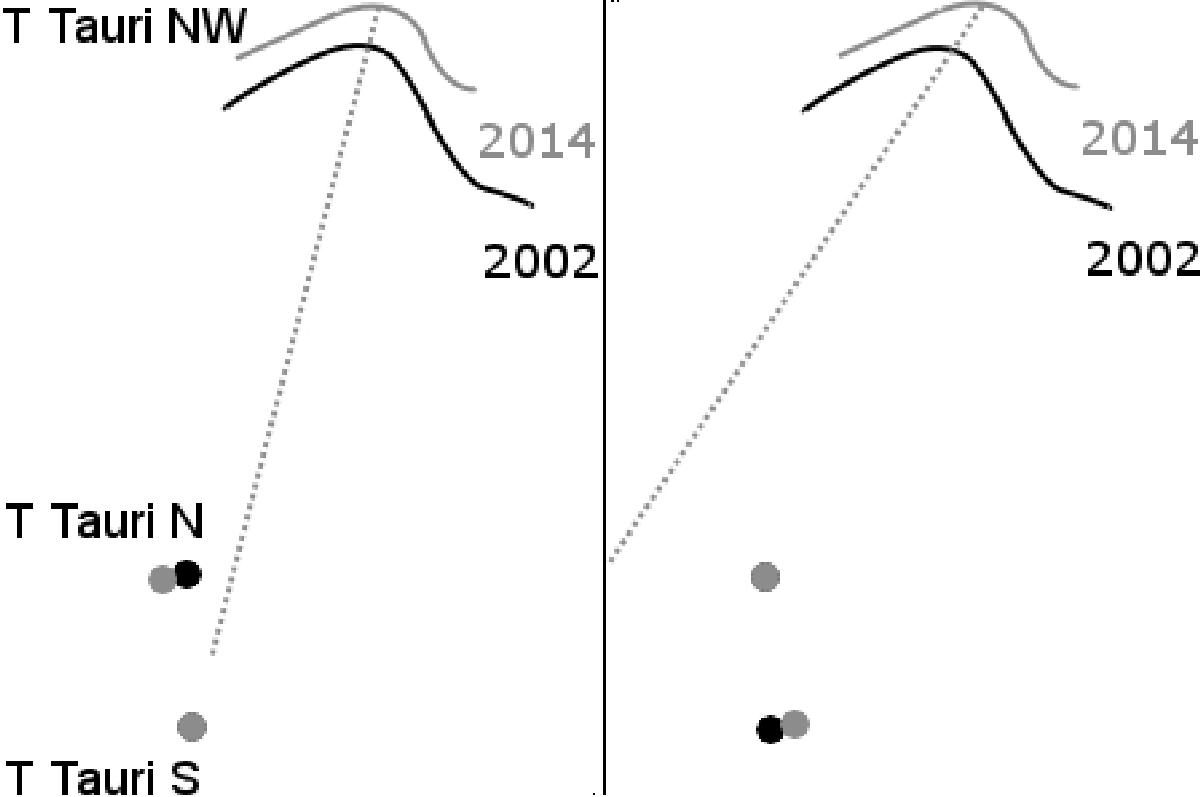
Overlay of the relative positions of T Tauri NW, N, and Sa in 2002 (Herbst et al. 2007) and 2014 (our data). The left panel shows the result when using T Tauri Sa as the centering reference, while the right panel uses T Tauri N.
Current usage metrics show cumulative count of Article Views (full-text article views including HTML views, PDF and ePub downloads, according to the available data) and Abstracts Views on Vision4Press platform.
Data correspond to usage on the plateform after 2015. The current usage metrics is available 48-96 hours after online publication and is updated daily on week days.
Initial download of the metrics may take a while.