Free Access
Fig. 8
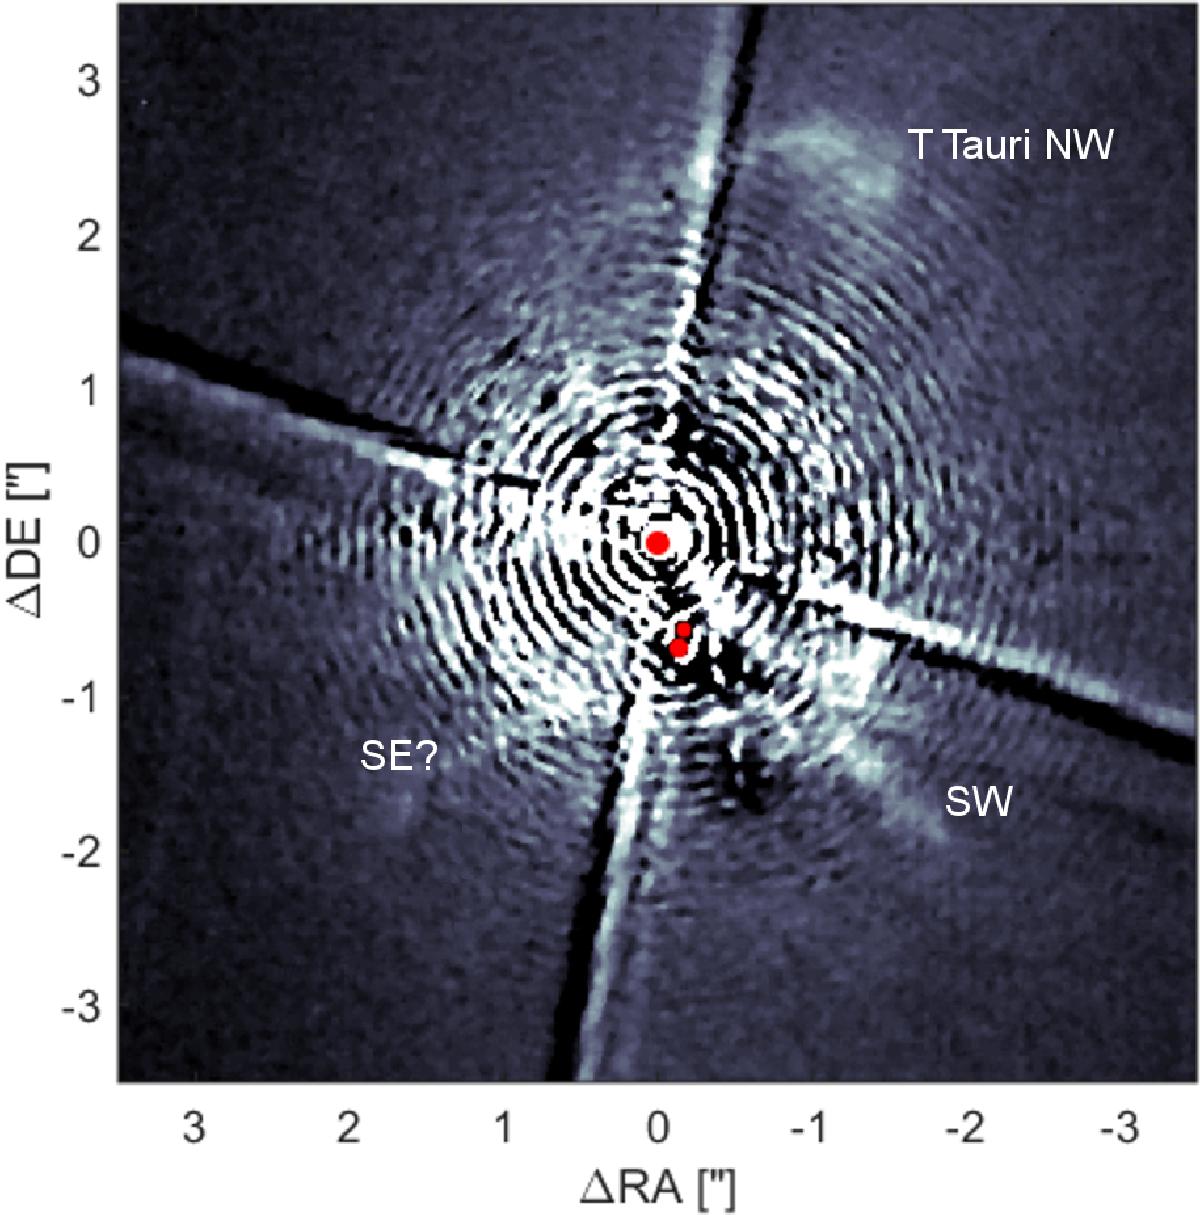
H2 line emission of T Tauri. The stars are indicated by the red circles. The arc/ring-like artifacts are due to the mismatch in wavelength between the two narrow band images and are made prominent by the grayscale stretch adjusted to show the low surface brightness H2 features.
Current usage metrics show cumulative count of Article Views (full-text article views including HTML views, PDF and ePub downloads, according to the available data) and Abstracts Views on Vision4Press platform.
Data correspond to usage on the plateform after 2015. The current usage metrics is available 48-96 hours after online publication and is updated daily on week days.
Initial download of the metrics may take a while.