Fig. 7
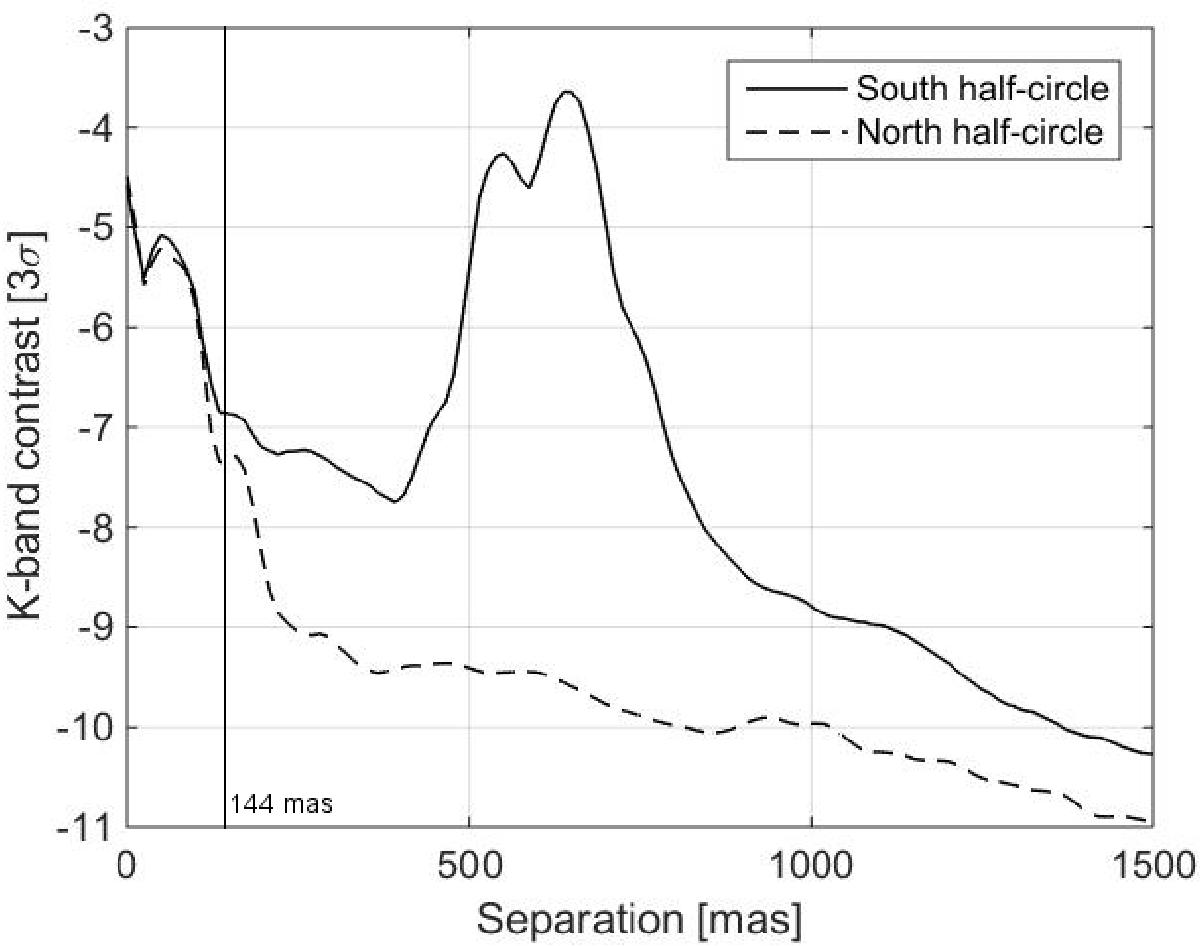
Magnitude contrast (3σ) obtained from the raw coronagraphic K1-band image (Fig. 5) with respect to T Tauri N. The contrast is derived as the flux standard deviation calculated over 4-pixel wide annuli at a given separation. We distinguish between the north and south half-circles because T Tauri S and its PSF residuals limit the contrast to the south. The thin vertical line indicates the separation of the tentative companion candidate at 144 mas (Csépány et al. 2015).
Current usage metrics show cumulative count of Article Views (full-text article views including HTML views, PDF and ePub downloads, according to the available data) and Abstracts Views on Vision4Press platform.
Data correspond to usage on the plateform after 2015. The current usage metrics is available 48-96 hours after online publication and is updated daily on week days.
Initial download of the metrics may take a while.