Fig. 1
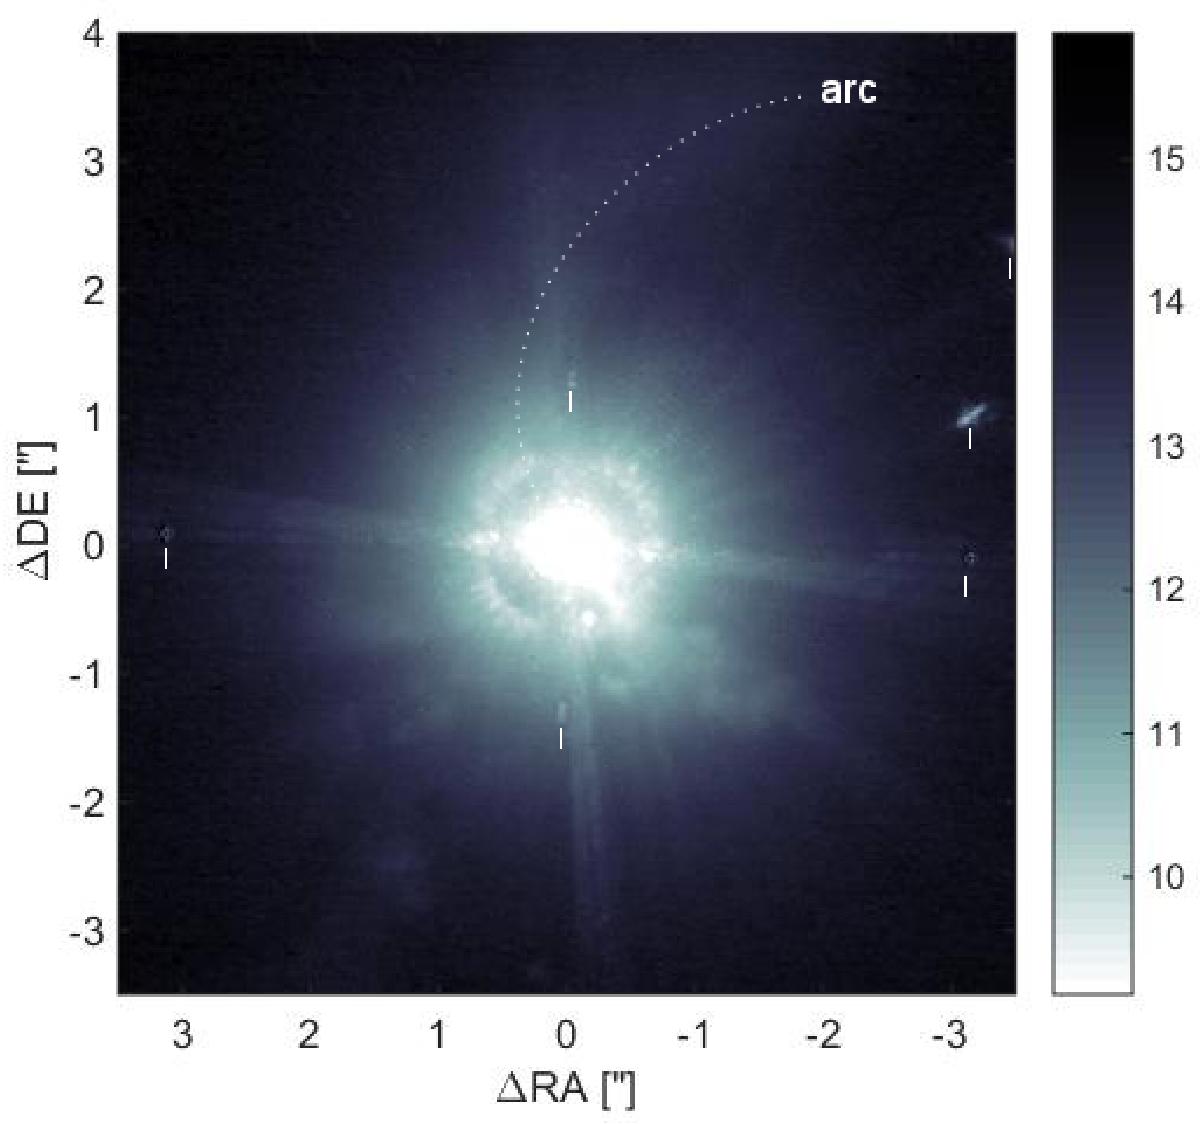
T Tauri in J-band extended emission. The image is displayed with a logarithmic color scale showing the flux level in magnitudes per arsecond2. The dotted arc indicates the northern arm of the reflection nebulosity discussed by Stapelfeldt et al. (1998). The image also contains several artifacts created by the narrow-band filters (above the vertical line segments) and by the AO correction (see text).
Current usage metrics show cumulative count of Article Views (full-text article views including HTML views, PDF and ePub downloads, according to the available data) and Abstracts Views on Vision4Press platform.
Data correspond to usage on the plateform after 2015. The current usage metrics is available 48-96 hours after online publication and is updated daily on week days.
Initial download of the metrics may take a while.