Fig. 2
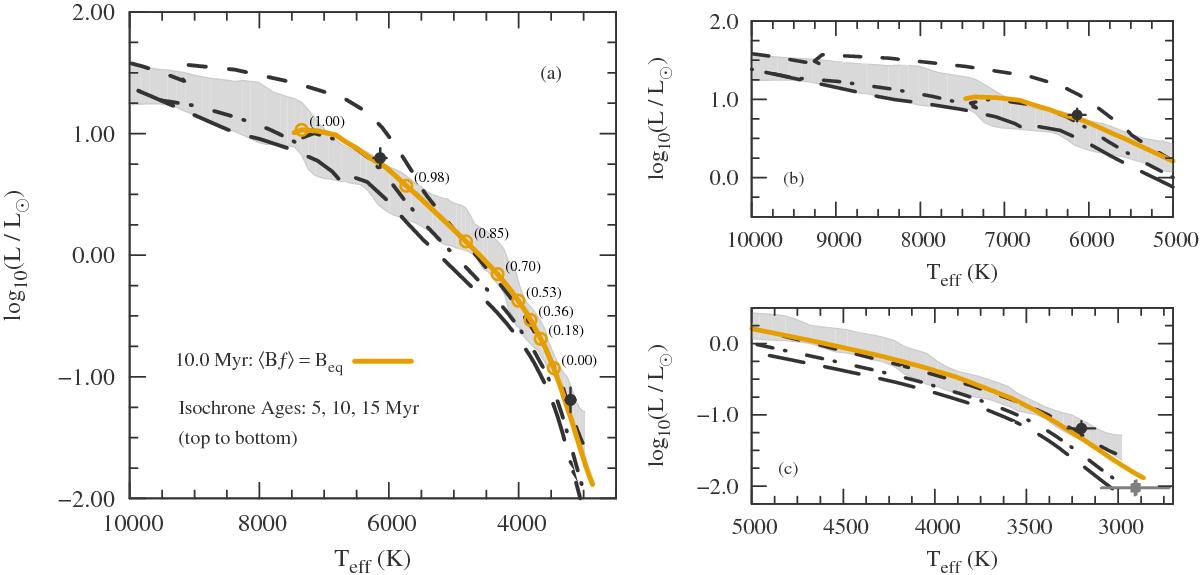
a) Comparison of theoretical Hertzsprung-Russell (HR) diagram predictions to the observational locus of Upper Scorpius. The median empirical locus calculated in Sect. 3 is shown by the light gray shaded region. Black points signify HR diagram positions of eclipsing binary members for which masses and radii are known. Over-plotted are predictions from Dartmouth stellar evolution isochrones. Standard (i.e., non-magnetic) isochrones at 5 Myr, 10 Myr, and 15 Myr are shown as short-dashed, dash-dotted, and long-dashed lines, respectively. A single magnetic isochrone at 10 Myr is plotted as a solid yellow line. Values in parentheses along the magnetic isochrone are predicted radiative core mass fractions (Mrad. core/M⋆) at the circled points. All models are computed with a solar metallicity. b) Zoom-in on the high-mass region of the HR diagram. c) Zoom-in on the low-mass region.
Current usage metrics show cumulative count of Article Views (full-text article views including HTML views, PDF and ePub downloads, according to the available data) and Abstracts Views on Vision4Press platform.
Data correspond to usage on the plateform after 2015. The current usage metrics is available 48-96 hours after online publication and is updated daily on week days.
Initial download of the metrics may take a while.