Fig. 1
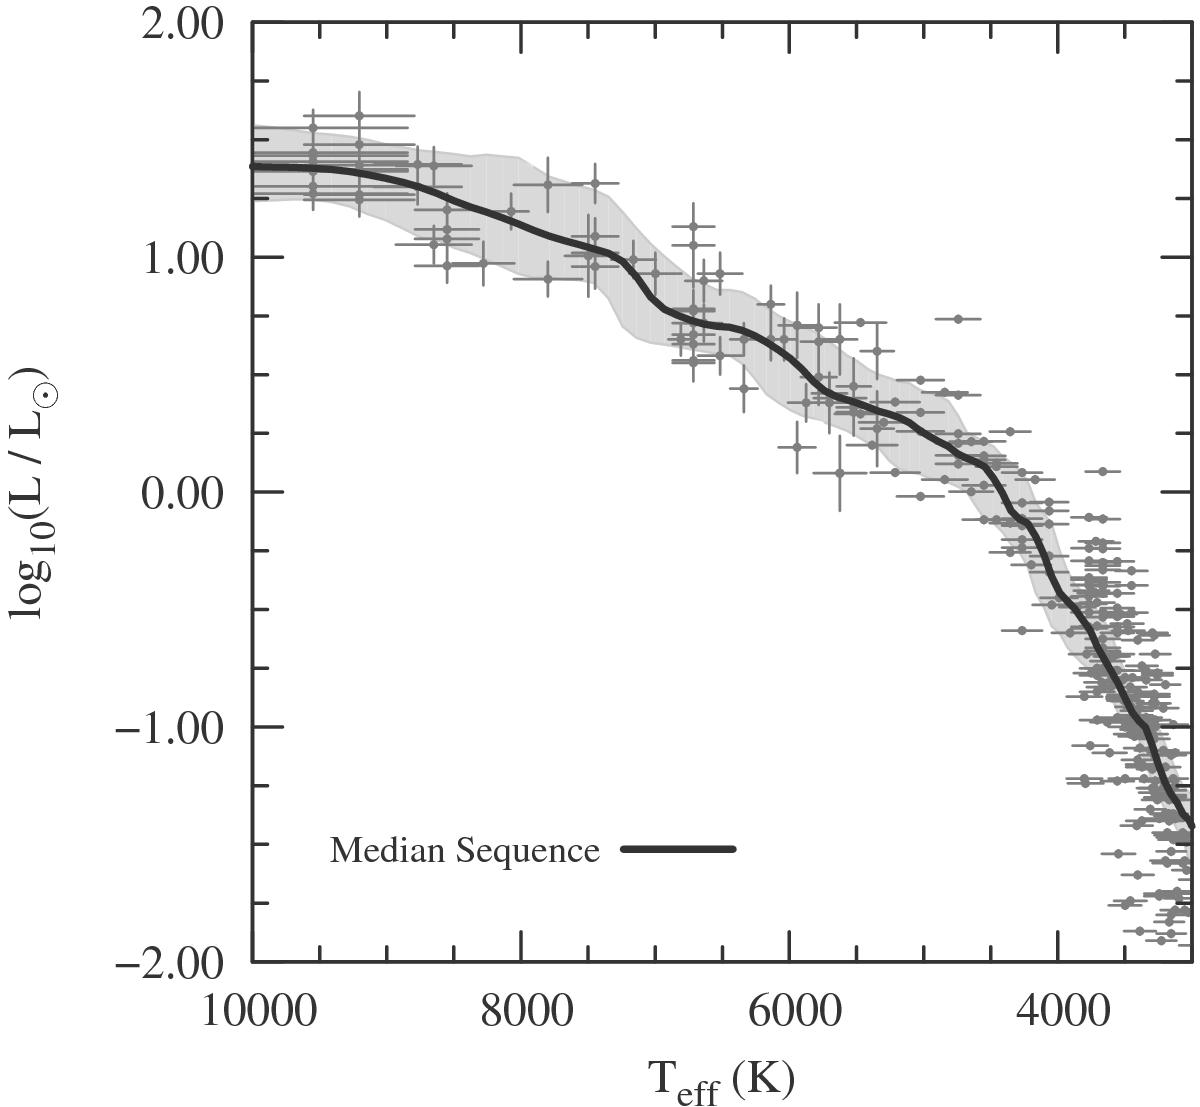
Hertzsprung-Russell (HR) diagram for Upper Scorpius. A-type through M-type members of Upper Scorpius (Preibisch & Zinnecker 1999; Preibisch et al. 2002; Pecaut et al. 2012) are shown as gray points. A median empirical locus for the population is shown as black solid line with the 99% confidence interval for the median value shown as a light-gray shaded region. Errorbars shown for the majority of stars with Teff< 5500 K are prescribed as described in Sect. 3.
Current usage metrics show cumulative count of Article Views (full-text article views including HTML views, PDF and ePub downloads, according to the available data) and Abstracts Views on Vision4Press platform.
Data correspond to usage on the plateform after 2015. The current usage metrics is available 48-96 hours after online publication and is updated daily on week days.
Initial download of the metrics may take a while.