Fig. 6
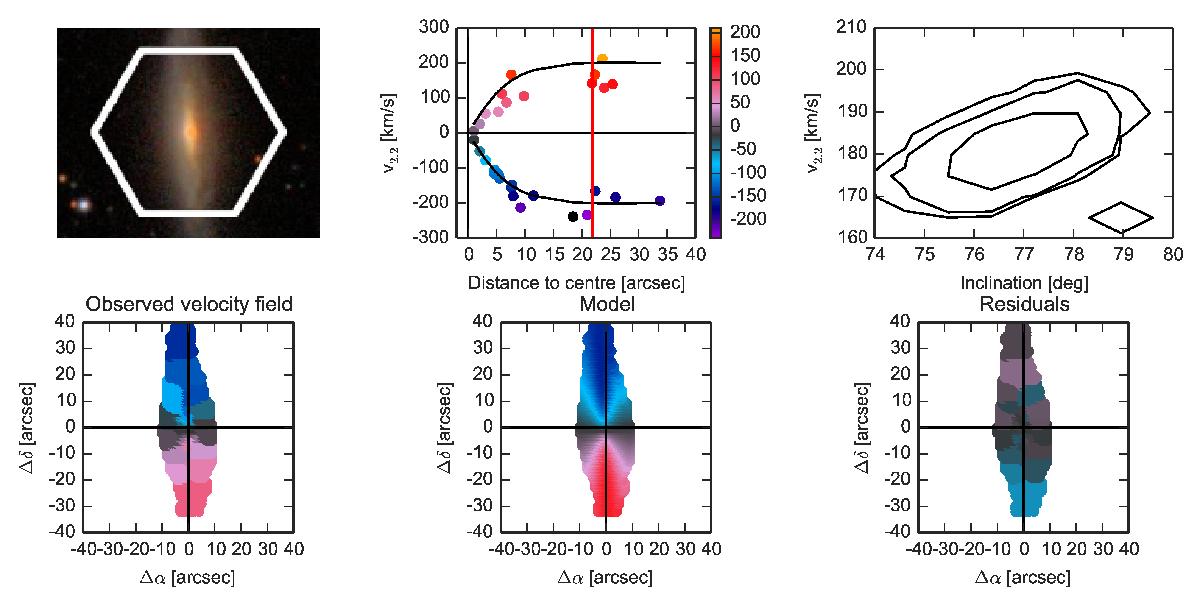
Velocity field of an inclined galaxy (IC5376, iphot = 80?). Top: SDSS composite image (left), model (black) and measured rotation curves (middle), joint i−v2.2 distribution (right, shown as 1, 2, and 3 standard deviation contours). Bottom: observed velocity field (left), model (middle), and residuals (right). The red line indicates the location of 2.2lsc. The velocity scale is the same in all panels.
Current usage metrics show cumulative count of Article Views (full-text article views including HTML views, PDF and ePub downloads, according to the available data) and Abstracts Views on Vision4Press platform.
Data correspond to usage on the plateform after 2015. The current usage metrics is available 48-96 hours after online publication and is updated daily on week days.
Initial download of the metrics may take a while.