Fig. 5
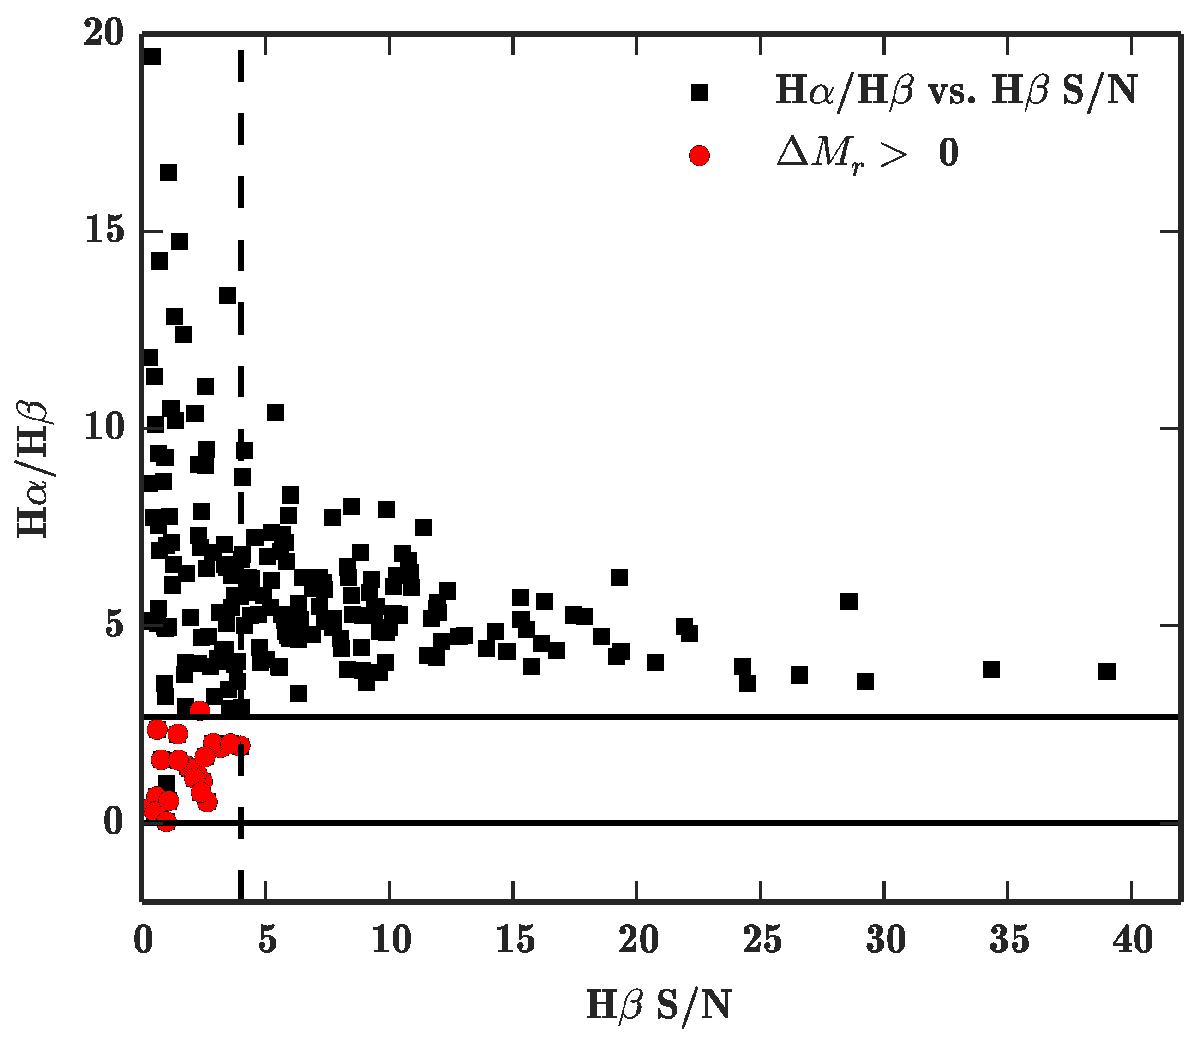
Balmer decrement vs. Hβ S/N. The red points are the galaxies that had unreliable extinction corrections due to their low S/N and correspondingly erroneous Balmer decrement values. The horizontal and vertical dashed lines show the region of probably untrustworthy extinction correction estimates. We used the mean magnitude of the extinction correction for these galaxies (see text).
Current usage metrics show cumulative count of Article Views (full-text article views including HTML views, PDF and ePub downloads, according to the available data) and Abstracts Views on Vision4Press platform.
Data correspond to usage on the plateform after 2015. The current usage metrics is available 48-96 hours after online publication and is updated daily on week days.
Initial download of the metrics may take a while.