Fig. 19
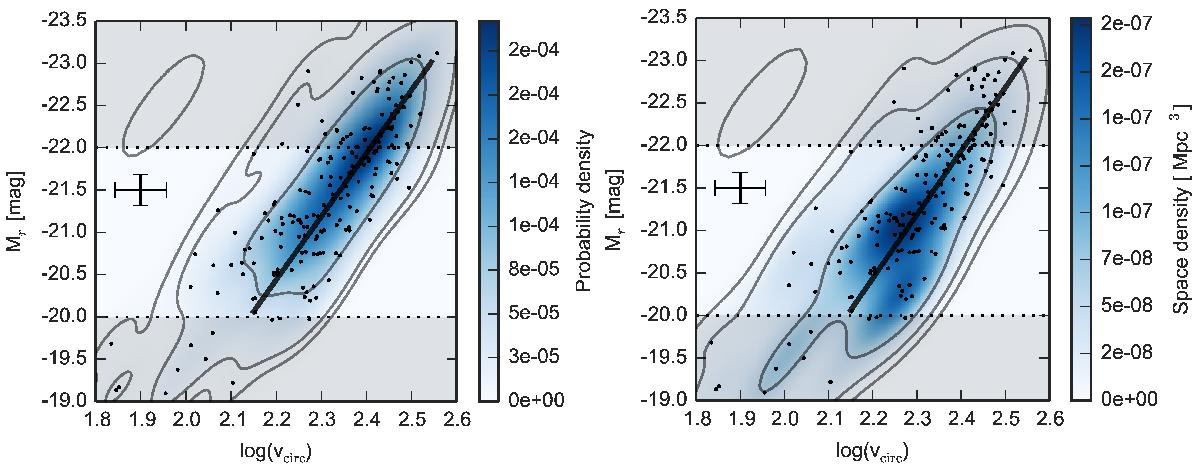
Left plot: joint probability density of ![]() -vcirc. Right plot: joint space densities distribution, estimated by weighting the KDE kernels by the 1 /Vmax weights. Grey lines denote the 1, 2, and 3 standard deviation contours. The black line shows the TFR discussed in the previous section. A 1σ contour of the Gaussian kernel used for density estimation is shown in the upper left corners. Grey shaded regions mark the regions where our sample is incomplete.
-vcirc. Right plot: joint space densities distribution, estimated by weighting the KDE kernels by the 1 /Vmax weights. Grey lines denote the 1, 2, and 3 standard deviation contours. The black line shows the TFR discussed in the previous section. A 1σ contour of the Gaussian kernel used for density estimation is shown in the upper left corners. Grey shaded regions mark the regions where our sample is incomplete.
Current usage metrics show cumulative count of Article Views (full-text article views including HTML views, PDF and ePub downloads, according to the available data) and Abstracts Views on Vision4Press platform.
Data correspond to usage on the plateform after 2015. The current usage metrics is available 48-96 hours after online publication and is updated daily on week days.
Initial download of the metrics may take a while.