Fig. 18
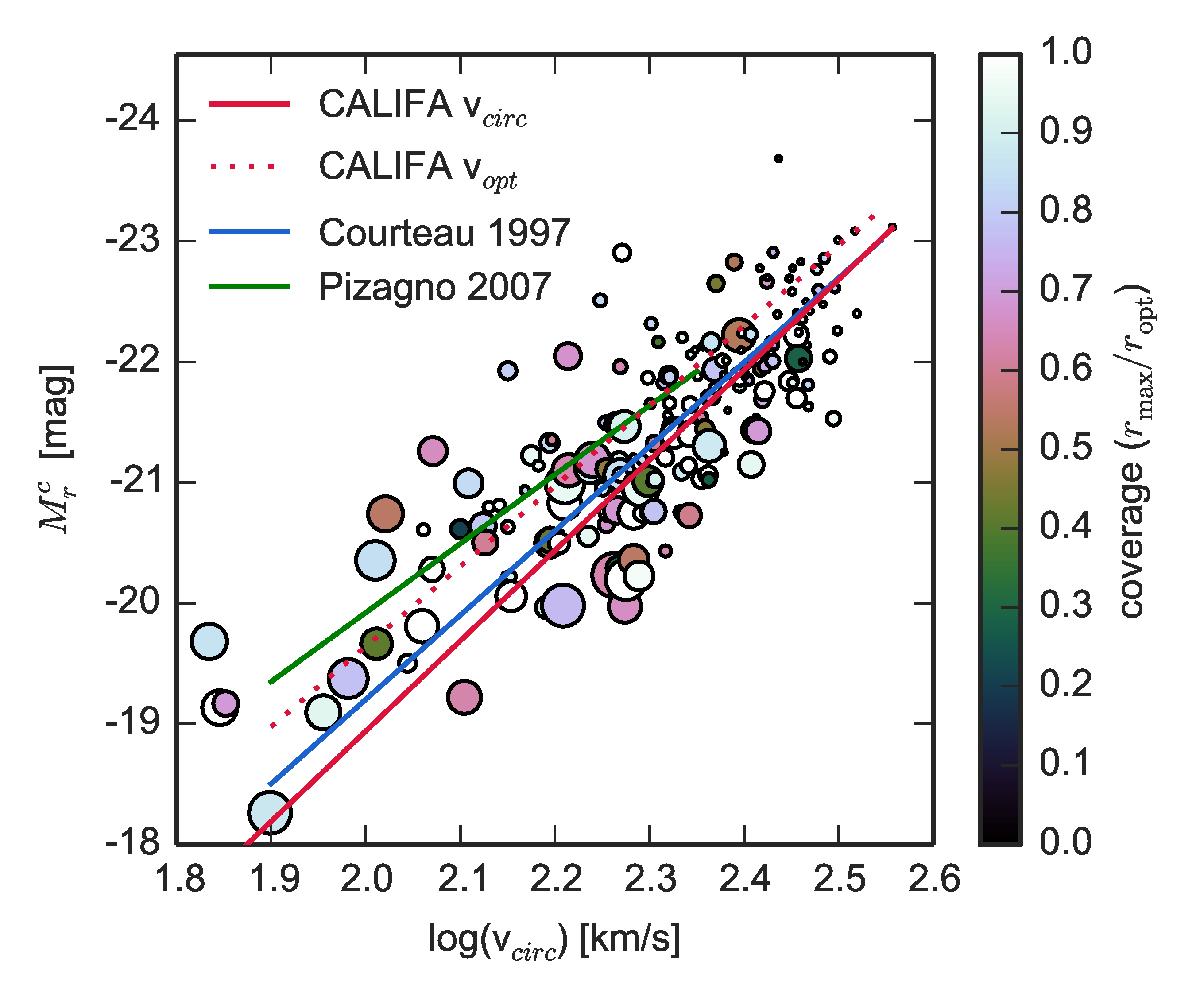
Linear fit (see text for more details) to CALIFA ![]() data, and comparison with Courteau (1997) and Pizagno et al. (2007) TF fits. Point sizes are proportional to 1 /Vmax weights, colours indicate insufficient spatial coverage of the velocity field (sampling of the rotation curve is lower than 1 ropt). The fit to
data, and comparison with Courteau (1997) and Pizagno et al. (2007) TF fits. Point sizes are proportional to 1 /Vmax weights, colours indicate insufficient spatial coverage of the velocity field (sampling of the rotation curve is lower than 1 ropt). The fit to ![]() is also shown in the plot.
is also shown in the plot.
Current usage metrics show cumulative count of Article Views (full-text article views including HTML views, PDF and ePub downloads, according to the available data) and Abstracts Views on Vision4Press platform.
Data correspond to usage on the plateform after 2015. The current usage metrics is available 48-96 hours after online publication and is updated daily on week days.
Initial download of the metrics may take a while.