Free Access
Fig. 17
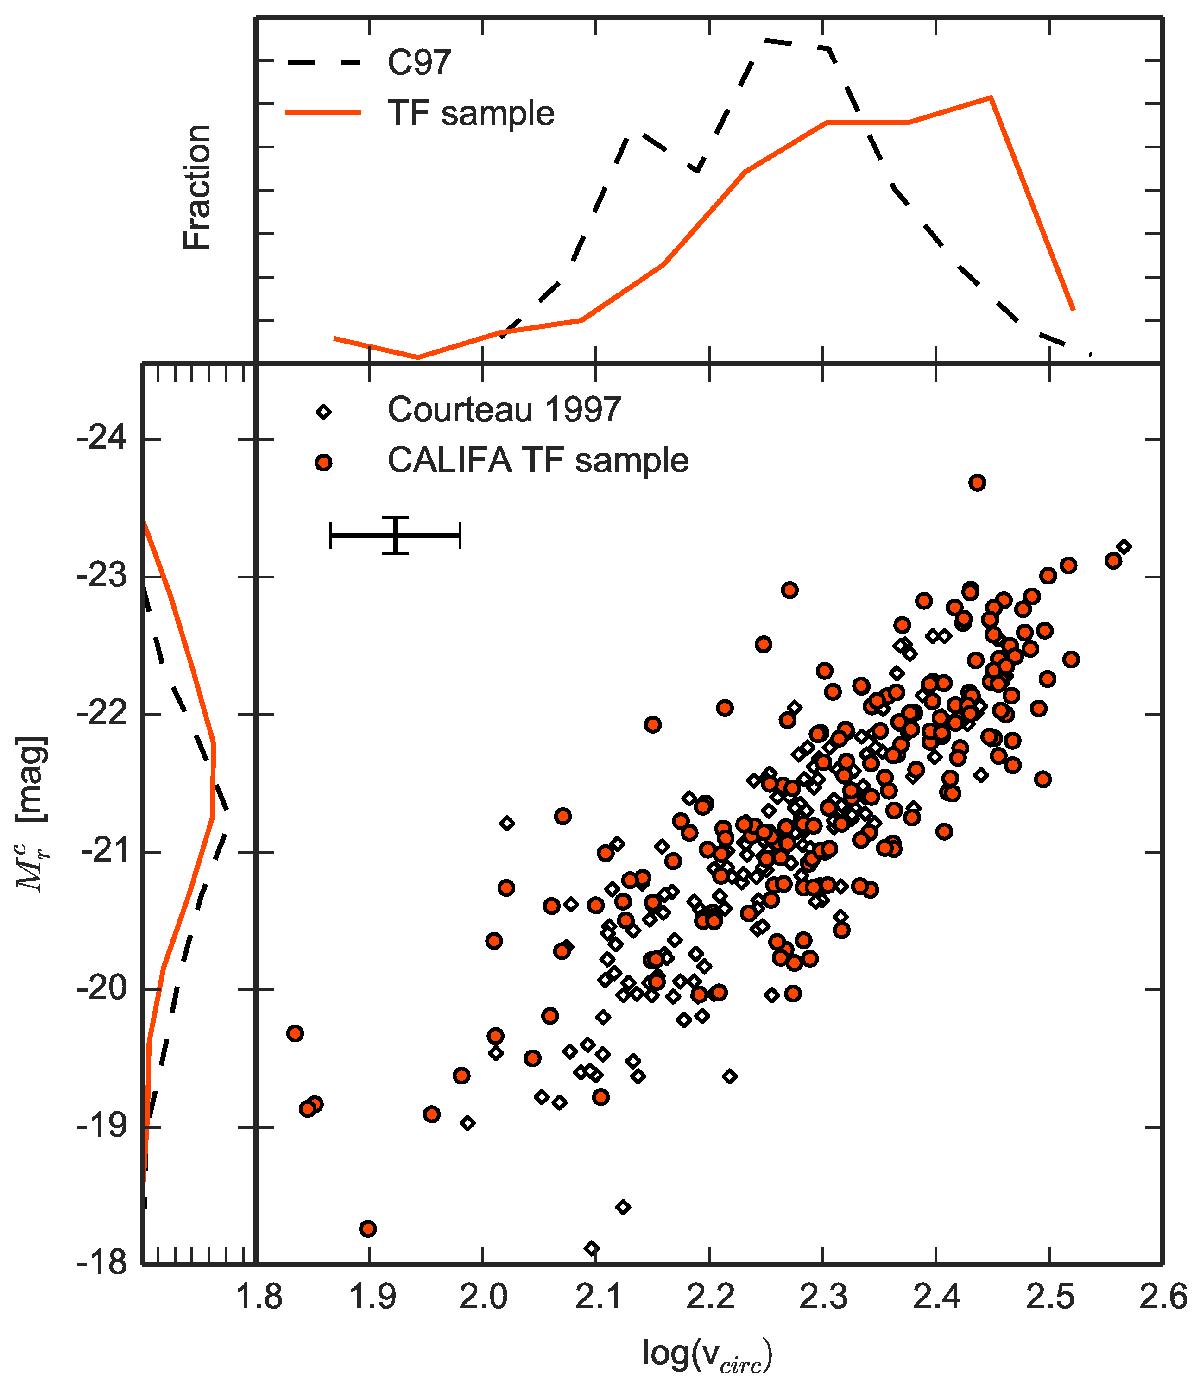
Comparison of our Tully-Fisher sample ![]() distribution and Courteau (1997, C97)
distribution and Courteau (1997, C97)![]() – Hαvopt measurements. The marginal plots show normalised histograms for both samples. The mean uncertainty magnitudes of CALIFA measurements are shown by the error bars.
– Hαvopt measurements. The marginal plots show normalised histograms for both samples. The mean uncertainty magnitudes of CALIFA measurements are shown by the error bars.
Current usage metrics show cumulative count of Article Views (full-text article views including HTML views, PDF and ePub downloads, according to the available data) and Abstracts Views on Vision4Press platform.
Data correspond to usage on the plateform after 2015. The current usage metrics is available 48-96 hours after online publication and is updated daily on week days.
Initial download of the metrics may take a while.