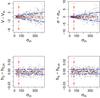
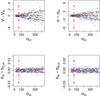
Fig. 4

Simulated values from the Monte Carlo simulations for the best bias parameter. The linear fits to the most distant points inside three times the standard deviation are plotted as blue long-dashed lines. These lines are subsequently used as errors on the associated parameters (see the text for details). Upper four plots: S/N = 30. Lower four plots: S/N = 50. The vertical red line is the observational resolution of 70 kms-1. The plots are for the case of the empirical Elodie stellar library.
Current usage metrics show cumulative count of Article Views (full-text article views including HTML views, PDF and ePub downloads, according to the available data) and Abstracts Views on Vision4Press platform.
Data correspond to usage on the plateform after 2015. The current usage metrics is available 48-96 hours after online publication and is updated daily on week days.
Initial download of the metrics may take a while.