Fig. 2
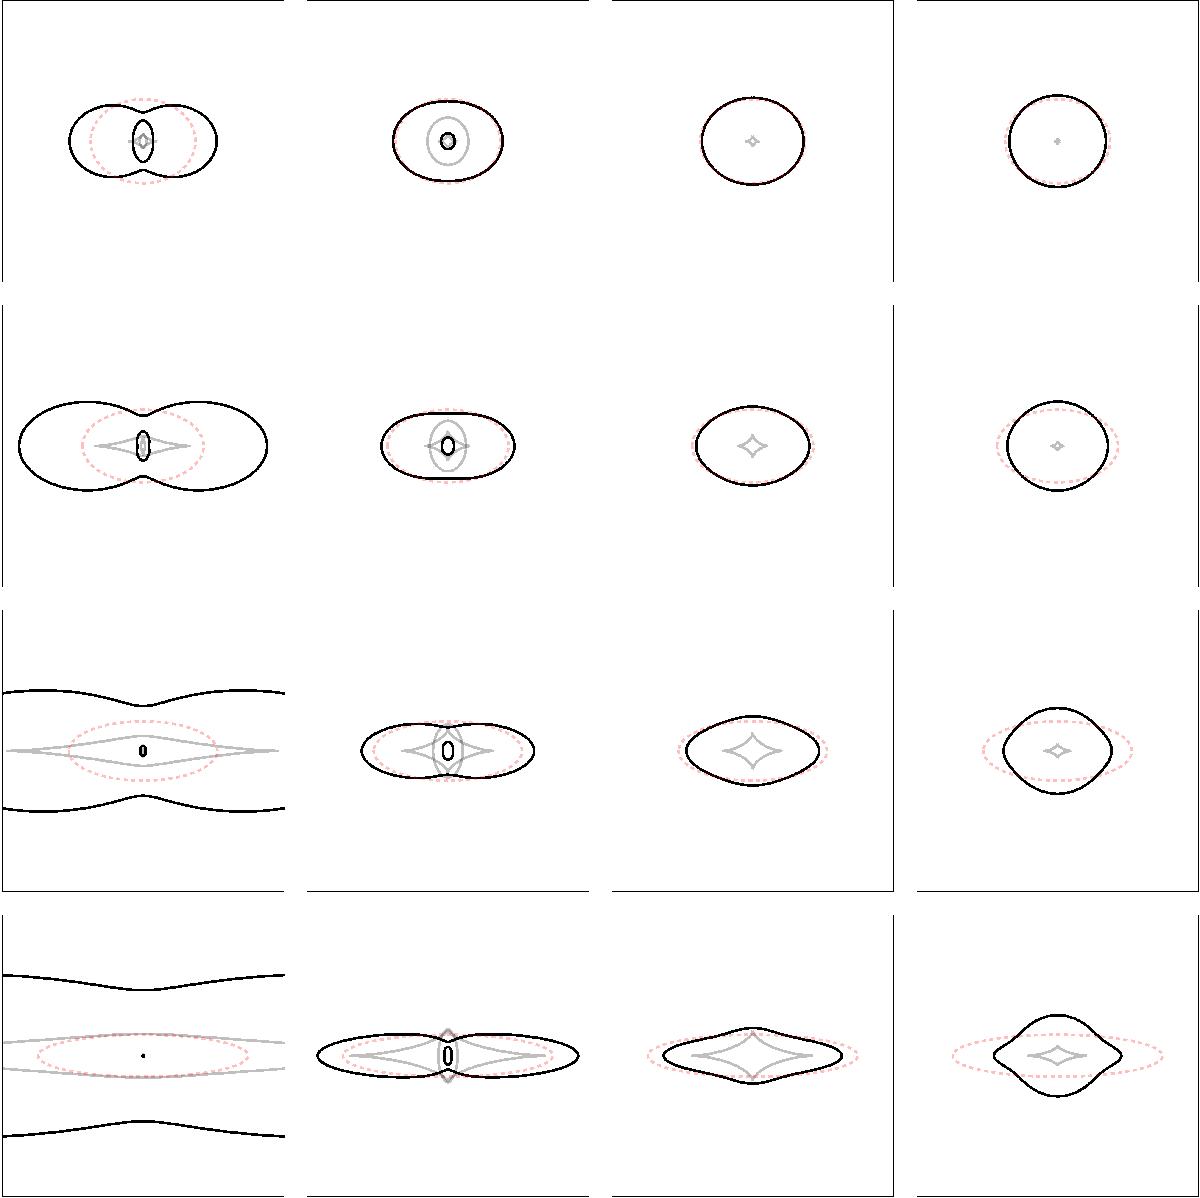
Critical lines (black) and caustics (grey) of the elliptical power law profile lens. Also shown is an ellipse with semi-minor axis equal to the scale length b and axis ratio q (red, dotted). For the purpose of illustration, the scale length b decreases as q1/2. The slope of the power law profile varies from t = 0.25 (left) to t = 1.75 (right) in steps of 0.5. The axis ratio varies from q = 0.8 (top) to q = 0.2 (bottom) in steps of 0.2.
Current usage metrics show cumulative count of Article Views (full-text article views including HTML views, PDF and ePub downloads, according to the available data) and Abstracts Views on Vision4Press platform.
Data correspond to usage on the plateform after 2015. The current usage metrics is available 48-96 hours after online publication and is updated daily on week days.
Initial download of the metrics may take a while.