Fig. 7
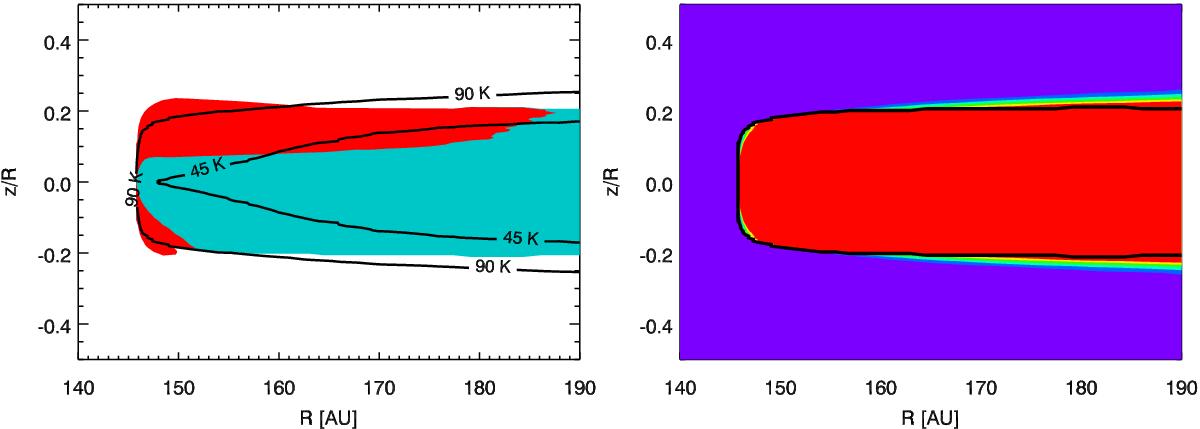
Left panel: red area indicates the region in the disk where 90% of the flux at 43 μm originates. The blue area is the region where ice can exist, i.e., the temperature is low enough, density high enough, and UV field weak enough. The contours show the temperature of the ice according to the feature position (45 K) and the crystallization temperature at one orbital timescale. Right panel: number of orbits required for the ice to crystallize. Colorscale: less than an orbit (purple), between 1 and 10 orbits (dark blue), between 10 and 100 orbits (light blue), between 100 and 1000 orbits (green), between 1000 and 10 000 orbits (yellow), and above 10 000 orbits (red). The thick black line indicates the region where ice can exist.
Current usage metrics show cumulative count of Article Views (full-text article views including HTML views, PDF and ePub downloads, according to the available data) and Abstracts Views on Vision4Press platform.
Data correspond to usage on the plateform after 2015. The current usage metrics is available 48-96 hours after online publication and is updated daily on week days.
Initial download of the metrics may take a while.