Fig. A.1
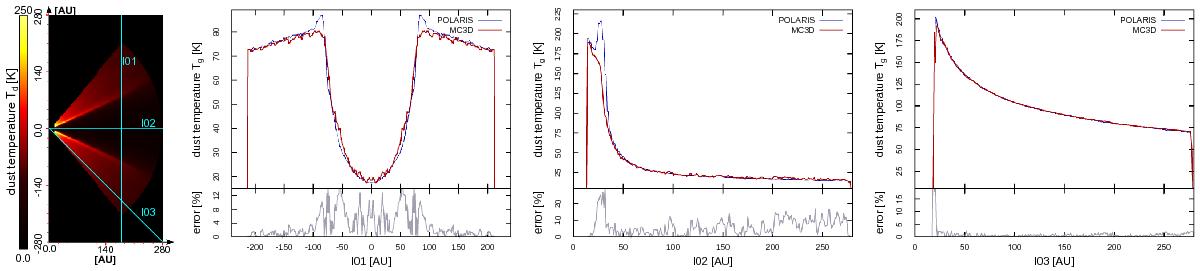
Resulting dust temperature Td for the D03 disk model (see Table 1). The outer left panel shows the temperature distribution in a plane perpendicular to the mid-plane of the disk. The plots show the temperature along the edge of the disk, perpendicular to the mid-plane (left plot), along the mid-plane of the disk (middle plot), and the distribution along the disks surface (right plot). The red lines show the results from the MC3D code, the blue ones the results from the POLARIS code, and the gray lines show the errors between both codes.
Current usage metrics show cumulative count of Article Views (full-text article views including HTML views, PDF and ePub downloads, according to the available data) and Abstracts Views on Vision4Press platform.
Data correspond to usage on the plateform after 2015. The current usage metrics is available 48-96 hours after online publication and is updated daily on week days.
Initial download of the metrics may take a while.