Fig. 6
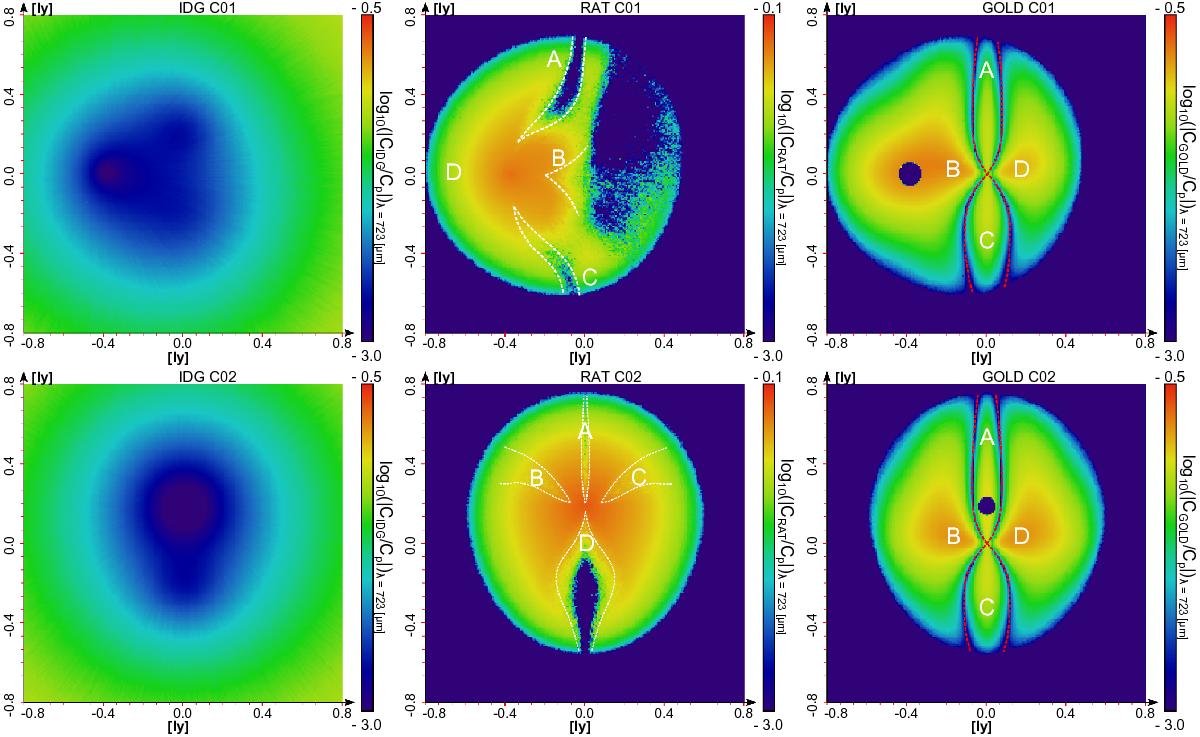
Ratio of polarization cross-sections ![]() of imperfectly aligned dust grains Cx, to perfectly aligned dust grain Cp in the mid-plane of the model space for the C01 model (top row) and C02 model (bottom row). The x stands for IDG alignment (left column), RAT alignment (middle column), and GOLD alignment (right column). In the middle columns, dotted white lines indicate the regions where the alignment efficiency QΓ(ϵ) is at its minimum. The dotted red lines in the right column show the transition where GOLD alignment changes the sign of linear polarization. The areas A−D correspond to that of Fig. 5.
of imperfectly aligned dust grains Cx, to perfectly aligned dust grain Cp in the mid-plane of the model space for the C01 model (top row) and C02 model (bottom row). The x stands for IDG alignment (left column), RAT alignment (middle column), and GOLD alignment (right column). In the middle columns, dotted white lines indicate the regions where the alignment efficiency QΓ(ϵ) is at its minimum. The dotted red lines in the right column show the transition where GOLD alignment changes the sign of linear polarization. The areas A−D correspond to that of Fig. 5.
Current usage metrics show cumulative count of Article Views (full-text article views including HTML views, PDF and ePub downloads, according to the available data) and Abstracts Views on Vision4Press platform.
Data correspond to usage on the plateform after 2015. The current usage metrics is available 48-96 hours after online publication and is updated daily on week days.
Initial download of the metrics may take a while.