Fig. 2
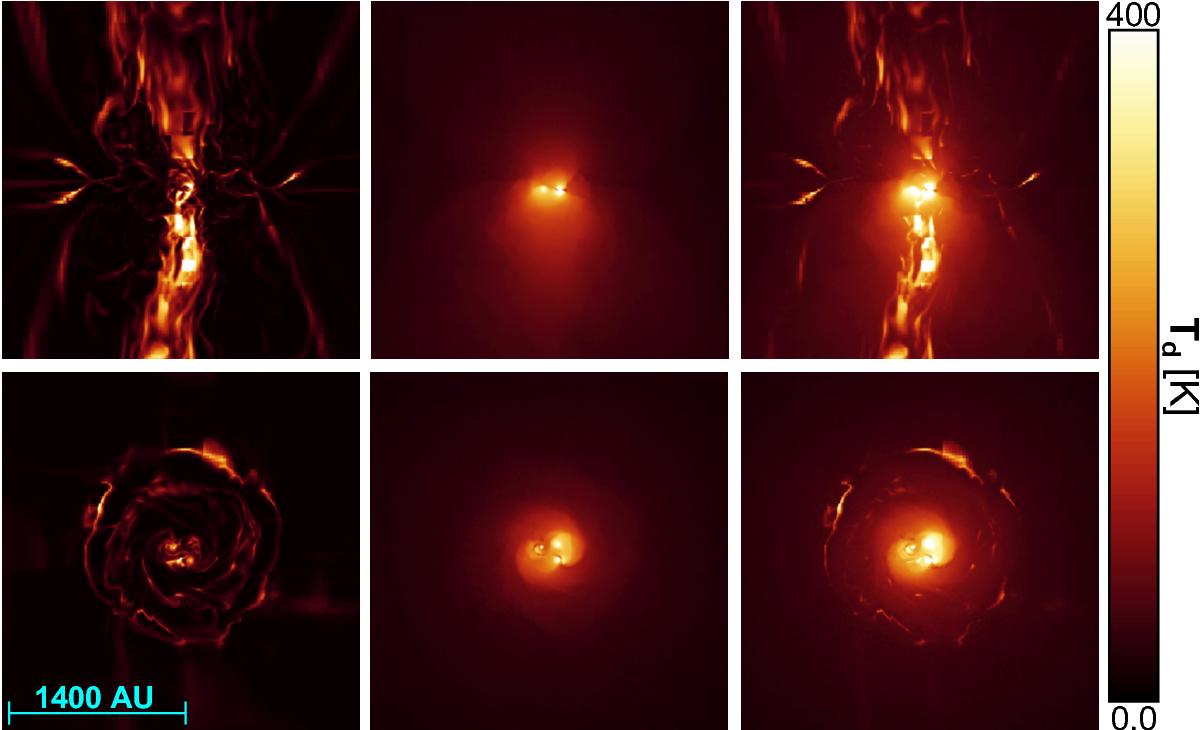
Dust temperature distribution in the mid-planes of a 3D MC-RT/MHD collapse simulation. Rows show the results of the same model, but of inclinations differing by 90°. In the left column, the dust was heated by 3D MC-RT simulation alone. The middle column shows the dust temperature distribution as a result of MHD shock heating. The dust temperature combined by offset dust heating, as described in Sect. 2.4, is shown in the right column. The length of 1400 AU is for scale. We applied an upper cut-off of 400 K (blue regions) to the mid-plane images for better illustration.
Current usage metrics show cumulative count of Article Views (full-text article views including HTML views, PDF and ePub downloads, according to the available data) and Abstracts Views on Vision4Press platform.
Data correspond to usage on the plateform after 2015. The current usage metrics is available 48-96 hours after online publication and is updated daily on week days.
Initial download of the metrics may take a while.