Free Access
Fig. A.1
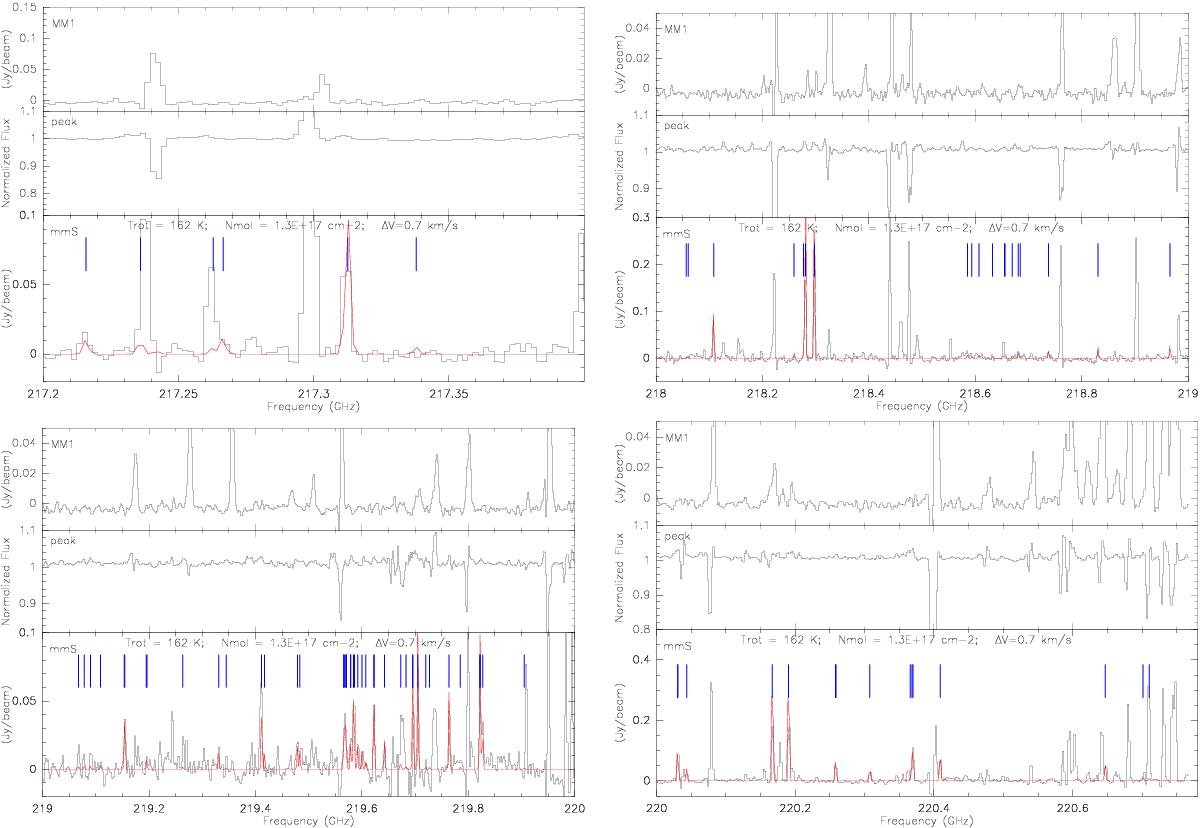
Synthetic fits of HCOOCH3 in NGC 7538 IRS1 (mmS and peak) and MM1. Black lines represent the observed spectra while red lines show the best-fit model based on optically thin assumption.
This figure is made of several images, please see below:
Current usage metrics show cumulative count of Article Views (full-text article views including HTML views, PDF and ePub downloads, according to the available data) and Abstracts Views on Vision4Press platform.
Data correspond to usage on the plateform after 2015. The current usage metrics is available 48-96 hours after online publication and is updated daily on week days.
Initial download of the metrics may take a while.