Fig. 8
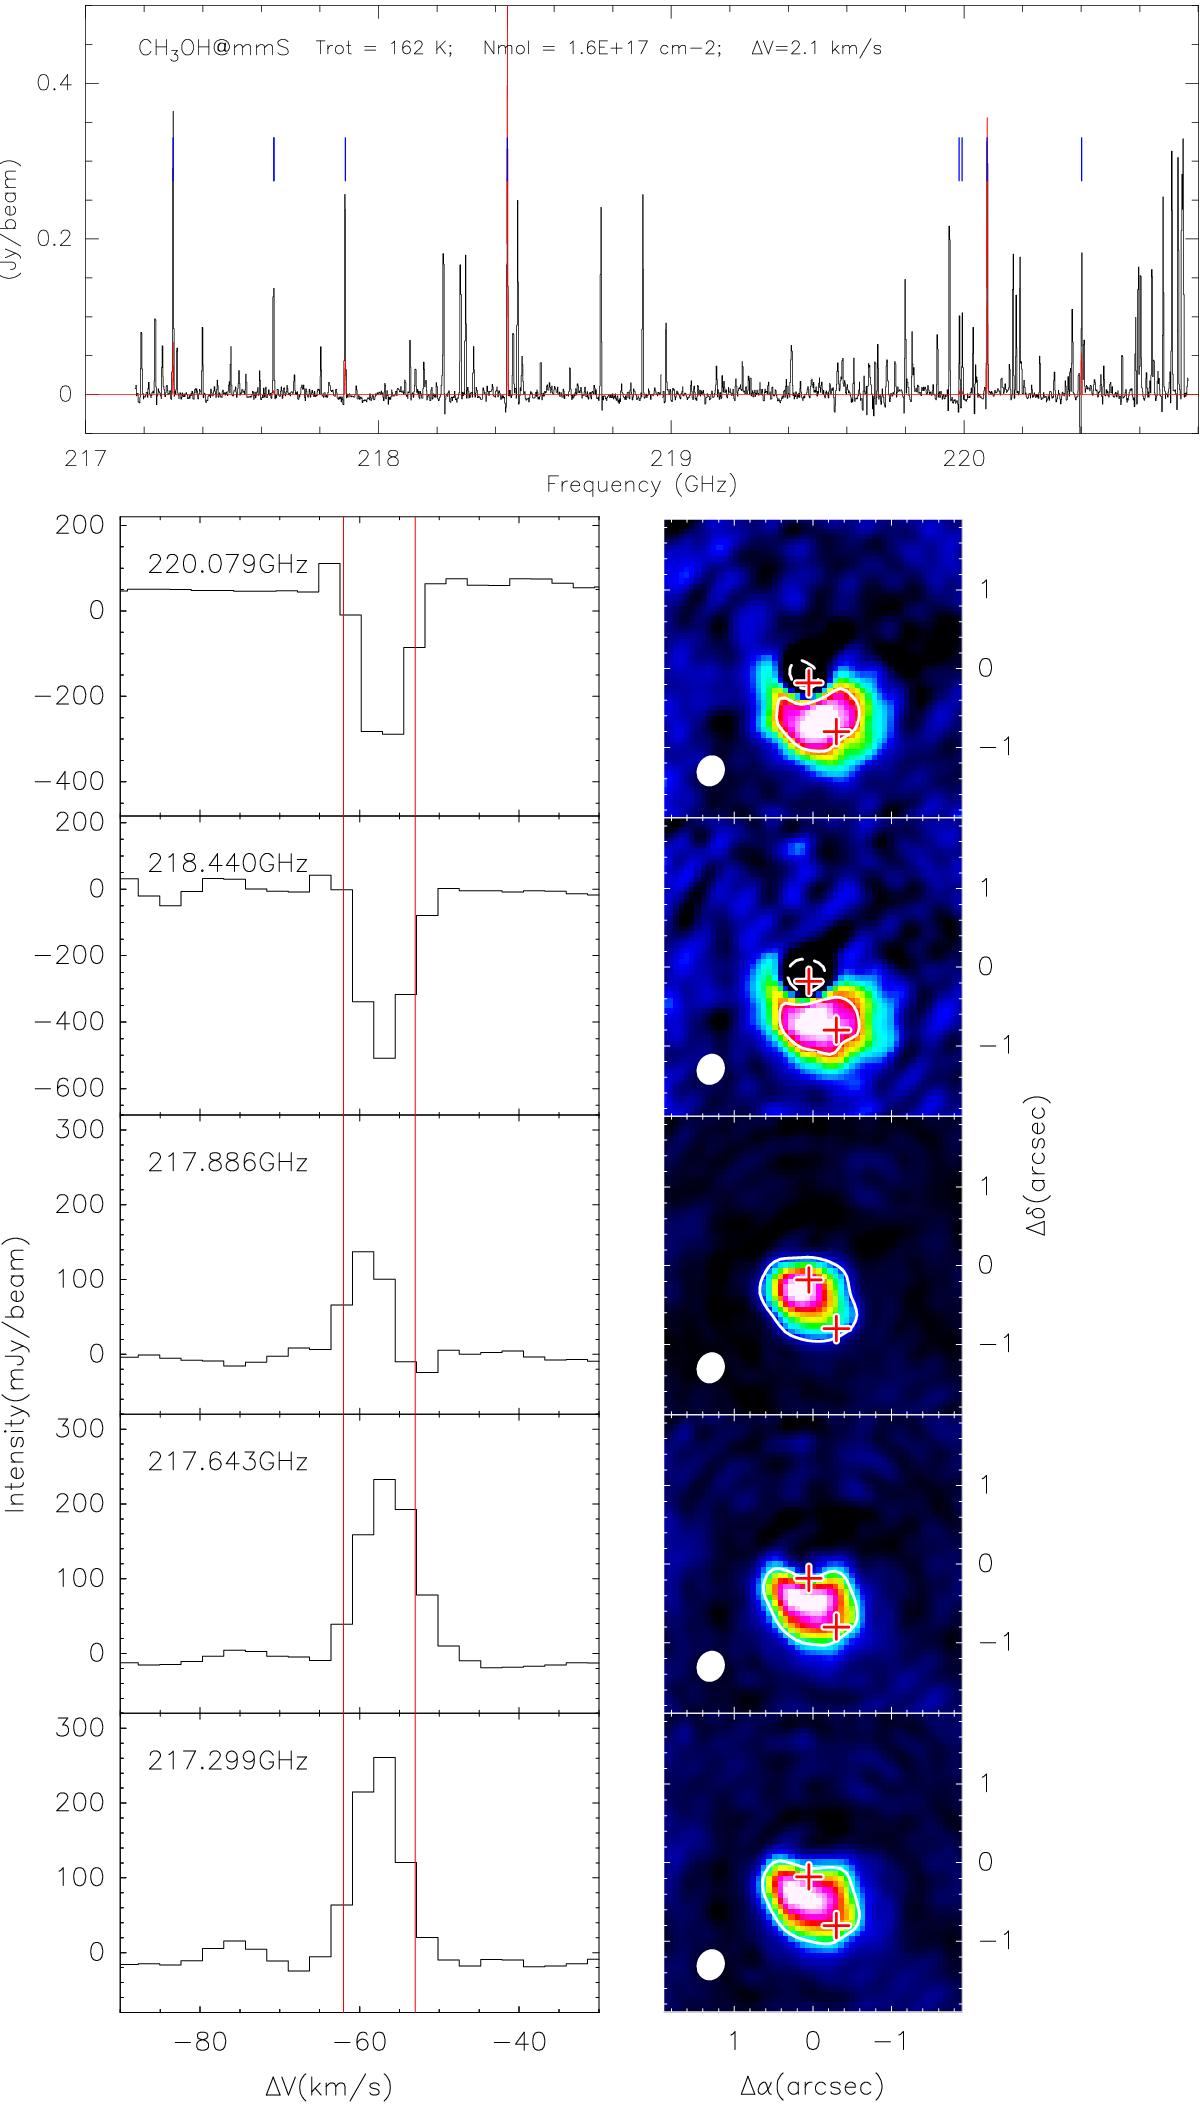
Upper panel: fitted CH3OH spectrum in IRS1-mmS. The black histogram is the observed spectrum, overlaid with the red fit whose parameters are listed. Blue lines mark transition frequencies at 217.299 GHz, 217.643 GHz, 217.886 GHz. Lower left panel: line profiles of CH3OH transitions from the IRS1-peak; right panel: corresponding intensity maps integrated over the velocity range from −63 to −53 km s-1 (Vlsr ~ −58 km s-1 at the continuum peak). The red crosses mark the IRS1-peak position and IRS1-mmS, and the yellow solid (dashed) contour shows ± 4σ rms level.
Current usage metrics show cumulative count of Article Views (full-text article views including HTML views, PDF and ePub downloads, according to the available data) and Abstracts Views on Vision4Press platform.
Data correspond to usage on the plateform after 2015. The current usage metrics is available 48-96 hours after online publication and is updated daily on week days.
Initial download of the metrics may take a while.