Fig. 7
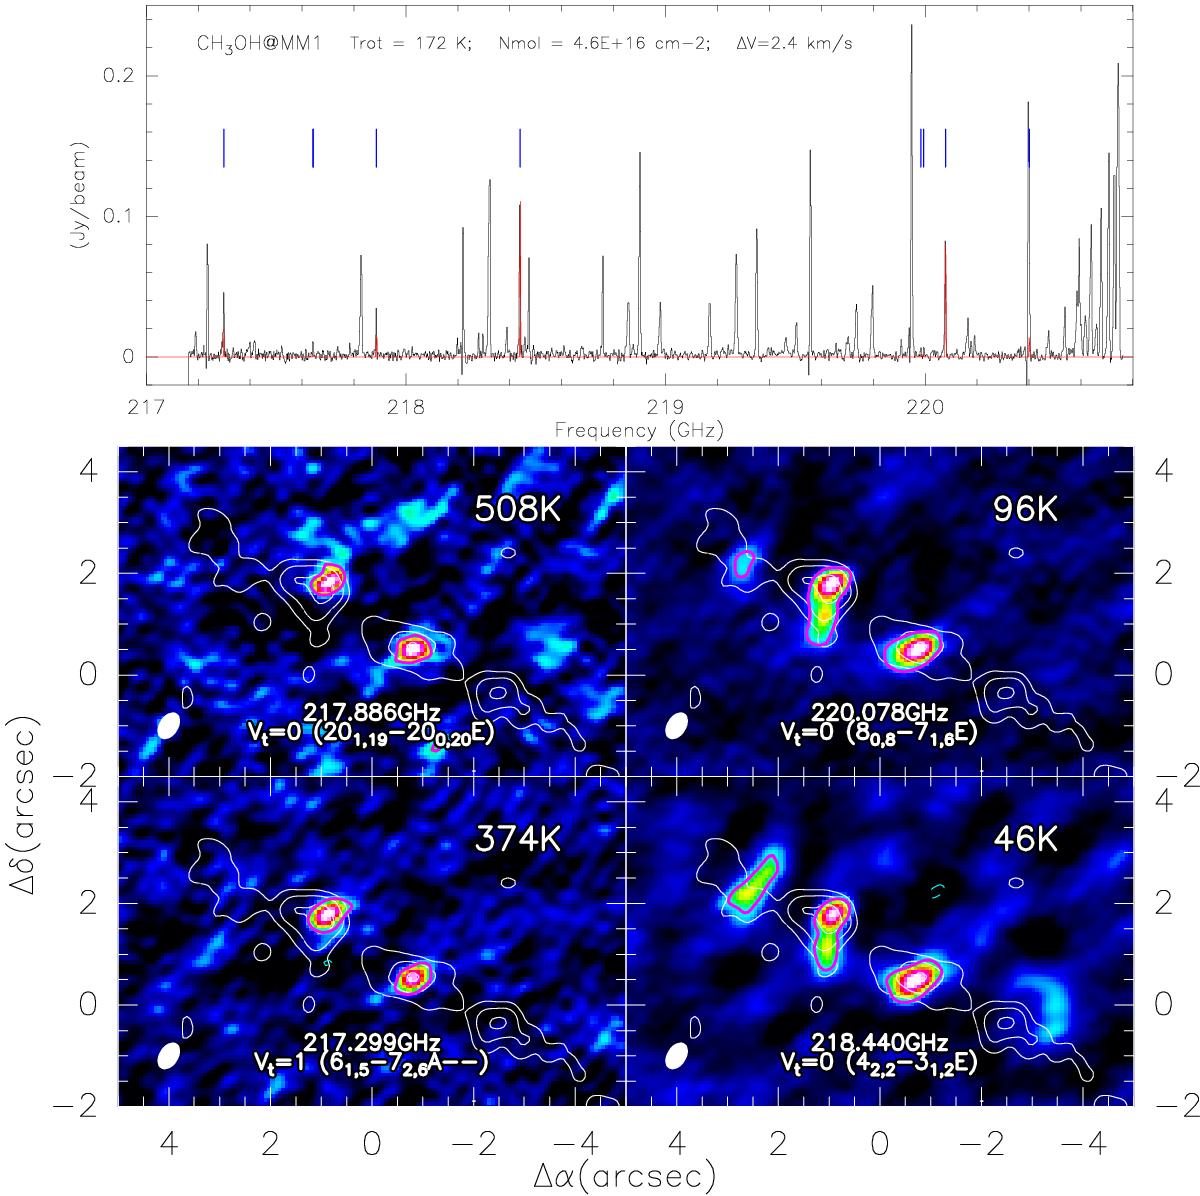
Upper panel: synthetic spectrum of CH3OH fitted to the MM1 data. The black histogram is the observed spectrum, overlaid with the red fit whose parameters are listed. Blue lines mark transition frequencies, and confirm that lines at 217.299 GHz, 217.643 GHz, 217.886 GHz are CH3OH. Lower panel: intensity integrated maps over the velocity range from −65 to −50 km s-1 (Vlsr ~ −60 km s-1 in MM1), with red contours showing the 3σ rms. White contours show the continuum (at 4σ, 14σ, and 24σ levels), purple contour reveals the region where molecular specific intensity > 3σ.
Current usage metrics show cumulative count of Article Views (full-text article views including HTML views, PDF and ePub downloads, according to the available data) and Abstracts Views on Vision4Press platform.
Data correspond to usage on the plateform after 2015. The current usage metrics is available 48-96 hours after online publication and is updated daily on week days.
Initial download of the metrics may take a while.