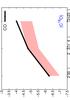
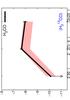
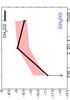
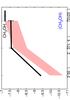
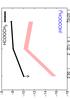
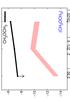
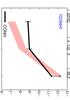
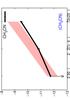
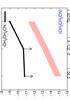
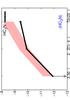
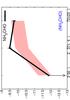
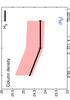
Fig. 6
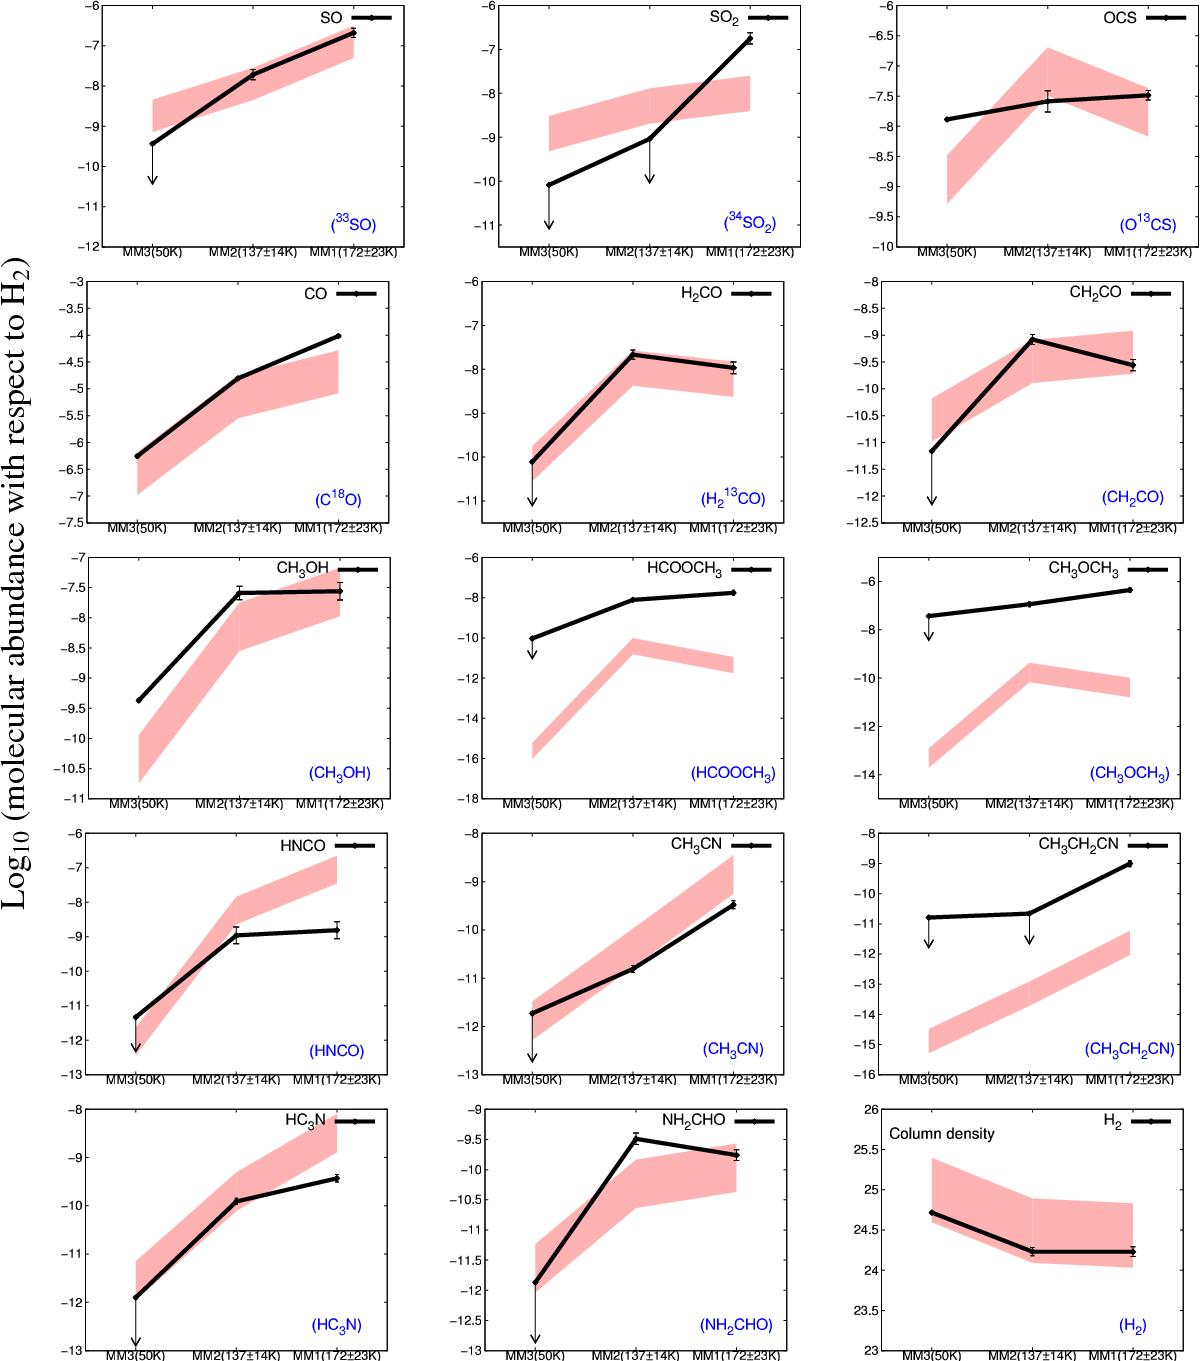
Best fit of molecular abundances in MM1–MM3, with the chemical ages of 11 200 yr, 11 210 yr, and 11 660 yr, respectively. The last panel shows the best fit of H2 column density, whose observed values are derived from dust emission. The modelled values and tolerance (0.1–10) are shown as a red filled region, while the observed values are plotted as solid black lines, with the uncertainties determined from Trot, partition function Q(Trot), and Gaussian fit to ![]() or scatter of transitions (CH3CN and HNCO). Abundances of species (name in black at the upper-right corner of each panel) are derived from their detected rare isotopologues, or opacity correction, or from optically thin assumption, which are all named in blue in parentheses at the lower-right corner of each panel.
or scatter of transitions (CH3CN and HNCO). Abundances of species (name in black at the upper-right corner of each panel) are derived from their detected rare isotopologues, or opacity correction, or from optically thin assumption, which are all named in blue in parentheses at the lower-right corner of each panel.
Current usage metrics show cumulative count of Article Views (full-text article views including HTML views, PDF and ePub downloads, according to the available data) and Abstracts Views on Vision4Press platform.
Data correspond to usage on the plateform after 2015. The current usage metrics is available 48-96 hours after online publication and is updated daily on week days.
Initial download of the metrics may take a while.