Fig. 5
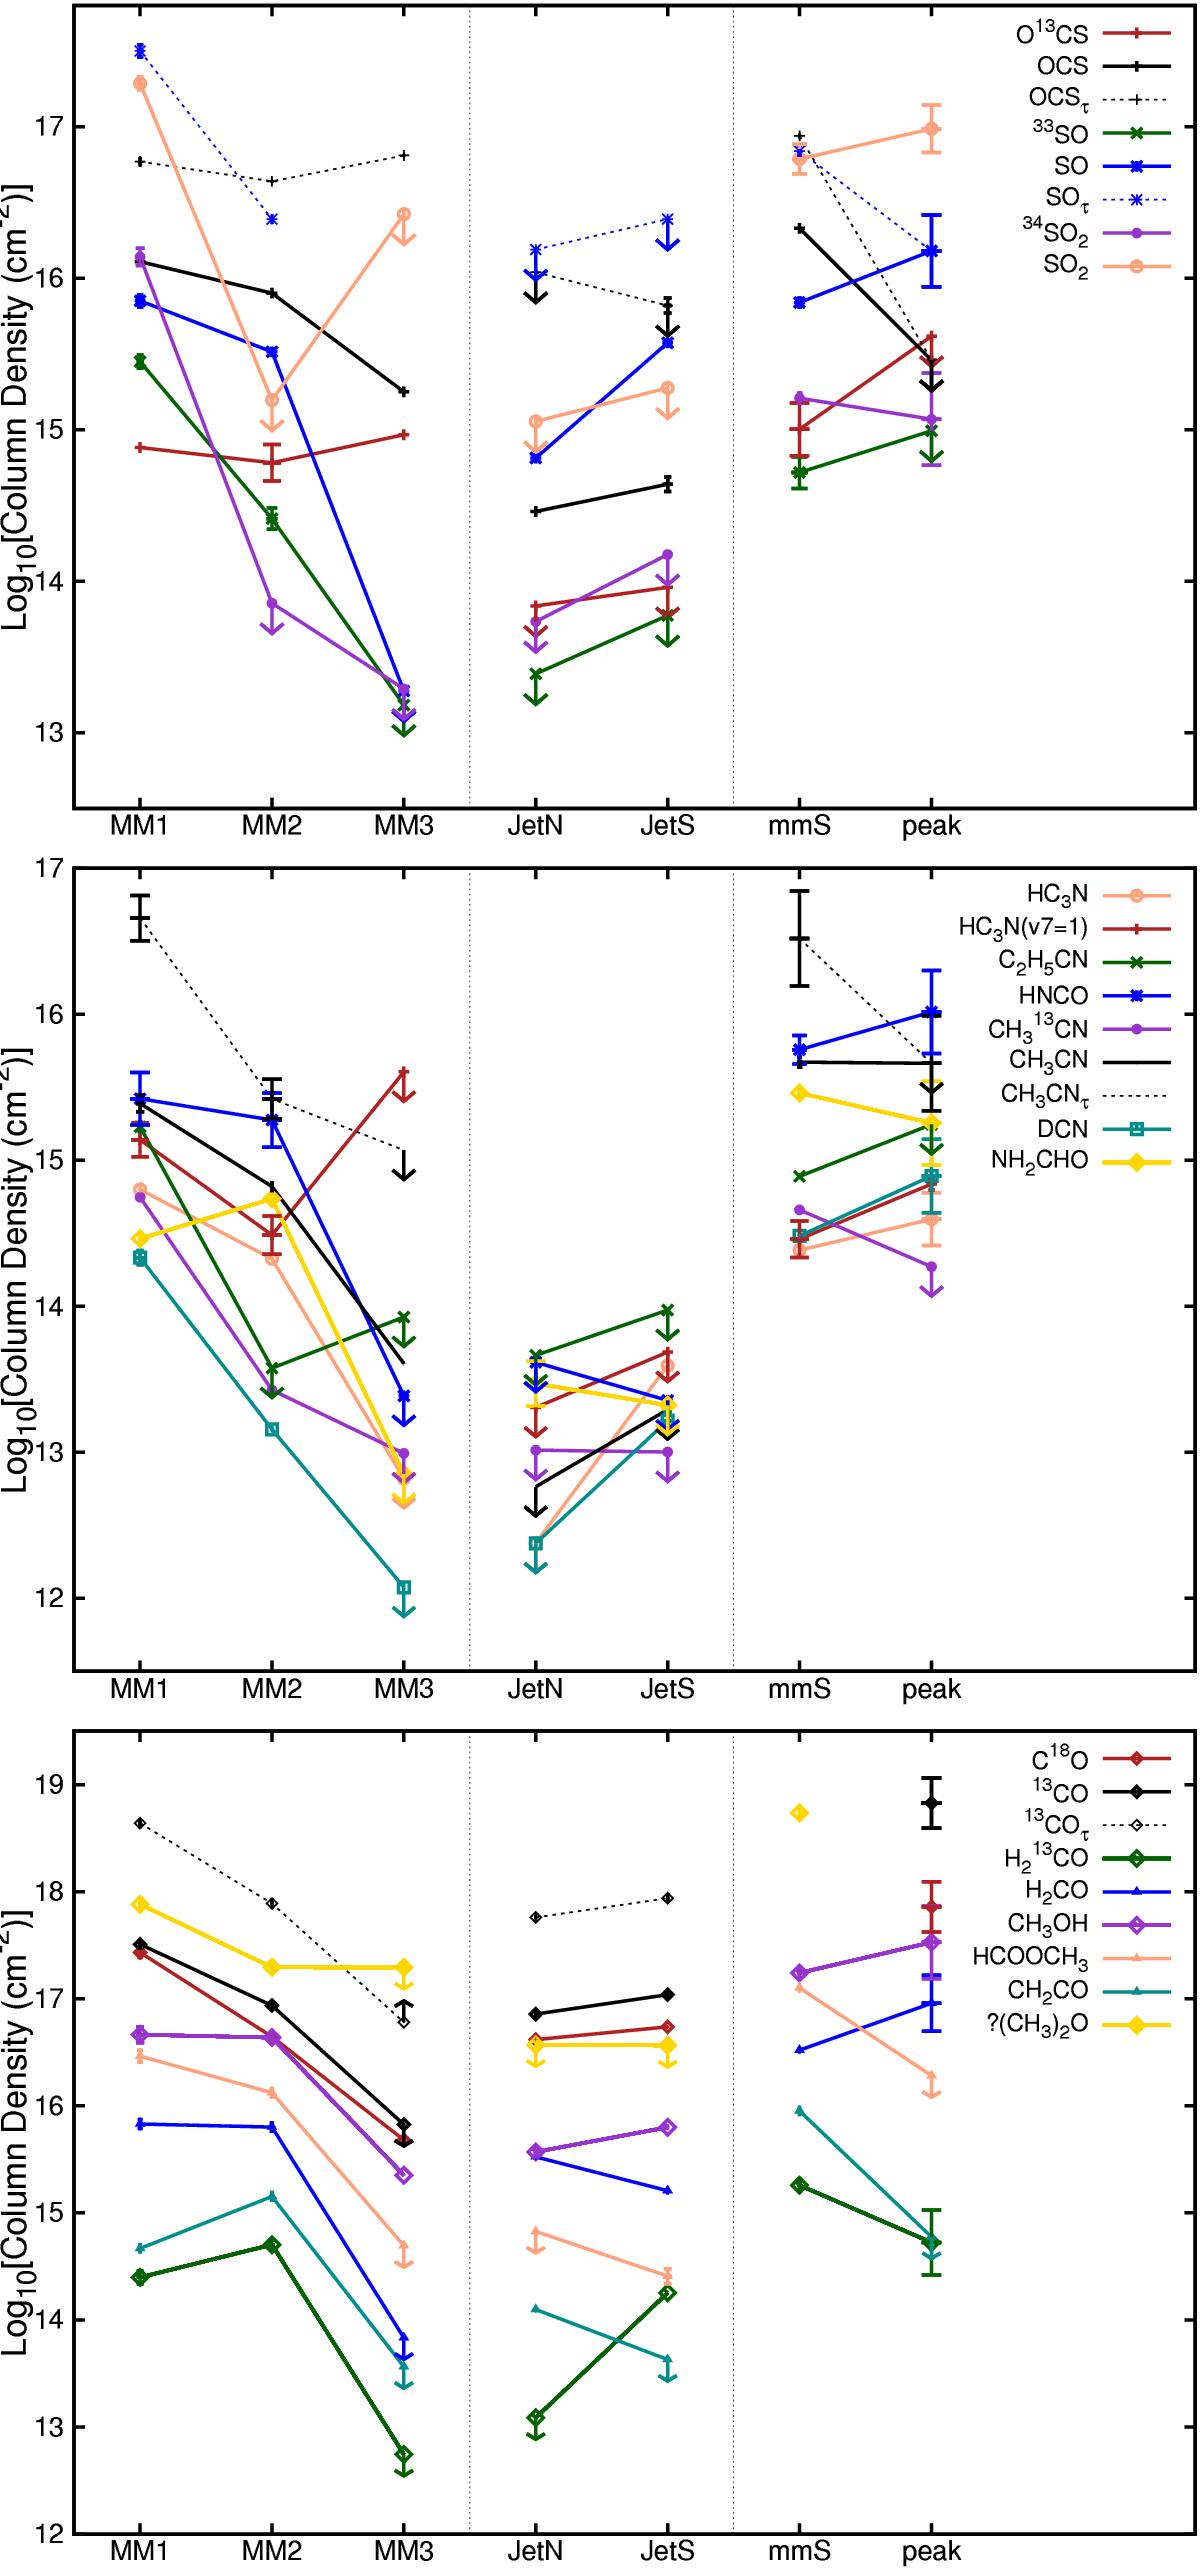
Molecular column densities toward 5 positions in NGC 7538 S and 2 positions in IRS1. Colored solid lines show the variation for each isotopologue calculated with the optically thin assumption (arrows highlight the upper and lower limits), while dashed lines (OCSτ, SOτ, CH3CNτ, 12COτ) show the variation calculated with opacity correction from Eq. (B.10). The uncertainties at each position are determined from Trot, partition function Q(Trot), Gaussian fit to ![]() , or the scatter of the multi-transitions on the rotation diagrames (CH3CN and HNCO). For species (e.g. HNCO, SO2) we have not measured the optical depths, the column densities could be underestimated by a factor of 5−10.
, or the scatter of the multi-transitions on the rotation diagrames (CH3CN and HNCO). For species (e.g. HNCO, SO2) we have not measured the optical depths, the column densities could be underestimated by a factor of 5−10.
Current usage metrics show cumulative count of Article Views (full-text article views including HTML views, PDF and ePub downloads, according to the available data) and Abstracts Views on Vision4Press platform.
Data correspond to usage on the plateform after 2015. The current usage metrics is available 48-96 hours after online publication and is updated daily on week days.
Initial download of the metrics may take a while.