Fig. 4
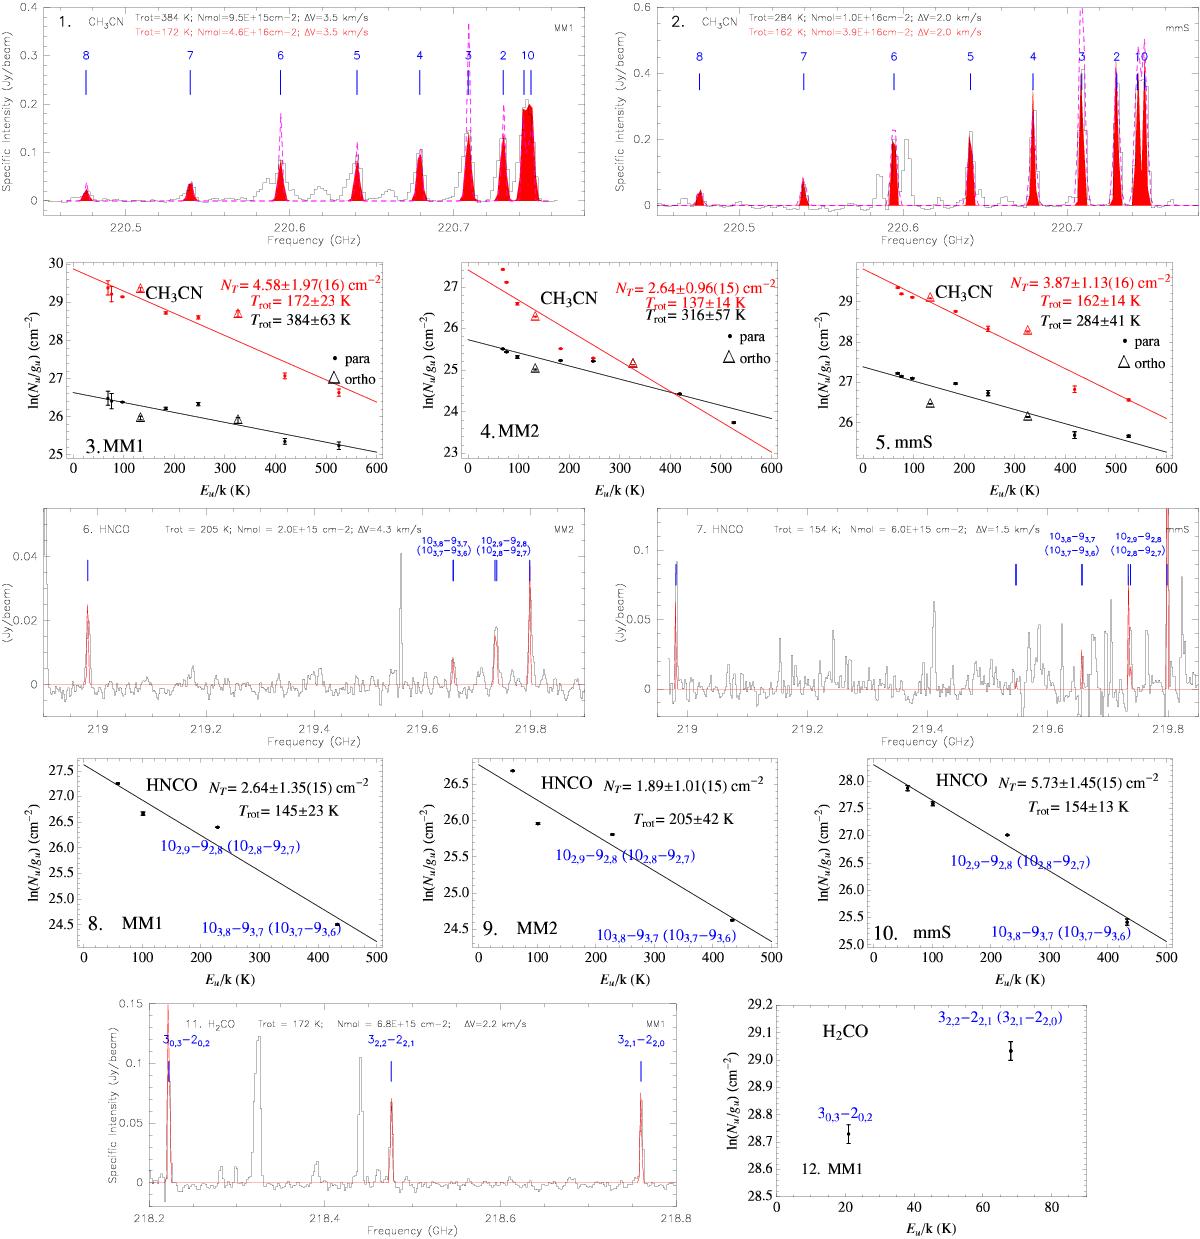
Rotation diagrames and synthetic spectrum fits of CH3CN, HNCO, and H2CO in MM1 (or MM2) and IRS1-mmS. Panels 1–2 present the CH3CN spectra towards MM1 and IRS1-mmS in black, fitting with optically thin assumption in dashed purple, and fitting with opacity correction in filled red. Panels 3–5 show the rotation diagrams of CH3CN derived for MM1, MM2, and IRS1-mmS, with black dots and fits corresponding to the optically thin assumption, whereas red dots and fits include correction for opacity. Panels 6–7 present the HNCO (assumed optically thin) synthetic spectrum fits towards MM2 and IRS1-mmS, with blended lines marked (fit in red). Panels 8–10 show the rotation diagrams of HNCO (assumed optically thin). Panel 11 presents the H2CO synthetic spectrum fits towards MM1. Panels 12 shows the data points of H2CO lines in MM1, which cannot be fitted in the rotation diagram. The estimated Trot and molecular column density from each rotation diagram is indicated in each panel. Errors are derived from scatter in the data points.
Current usage metrics show cumulative count of Article Views (full-text article views including HTML views, PDF and ePub downloads, according to the available data) and Abstracts Views on Vision4Press platform.
Data correspond to usage on the plateform after 2015. The current usage metrics is available 48-96 hours after online publication and is updated daily on week days.
Initial download of the metrics may take a while.