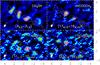
Fig. 3
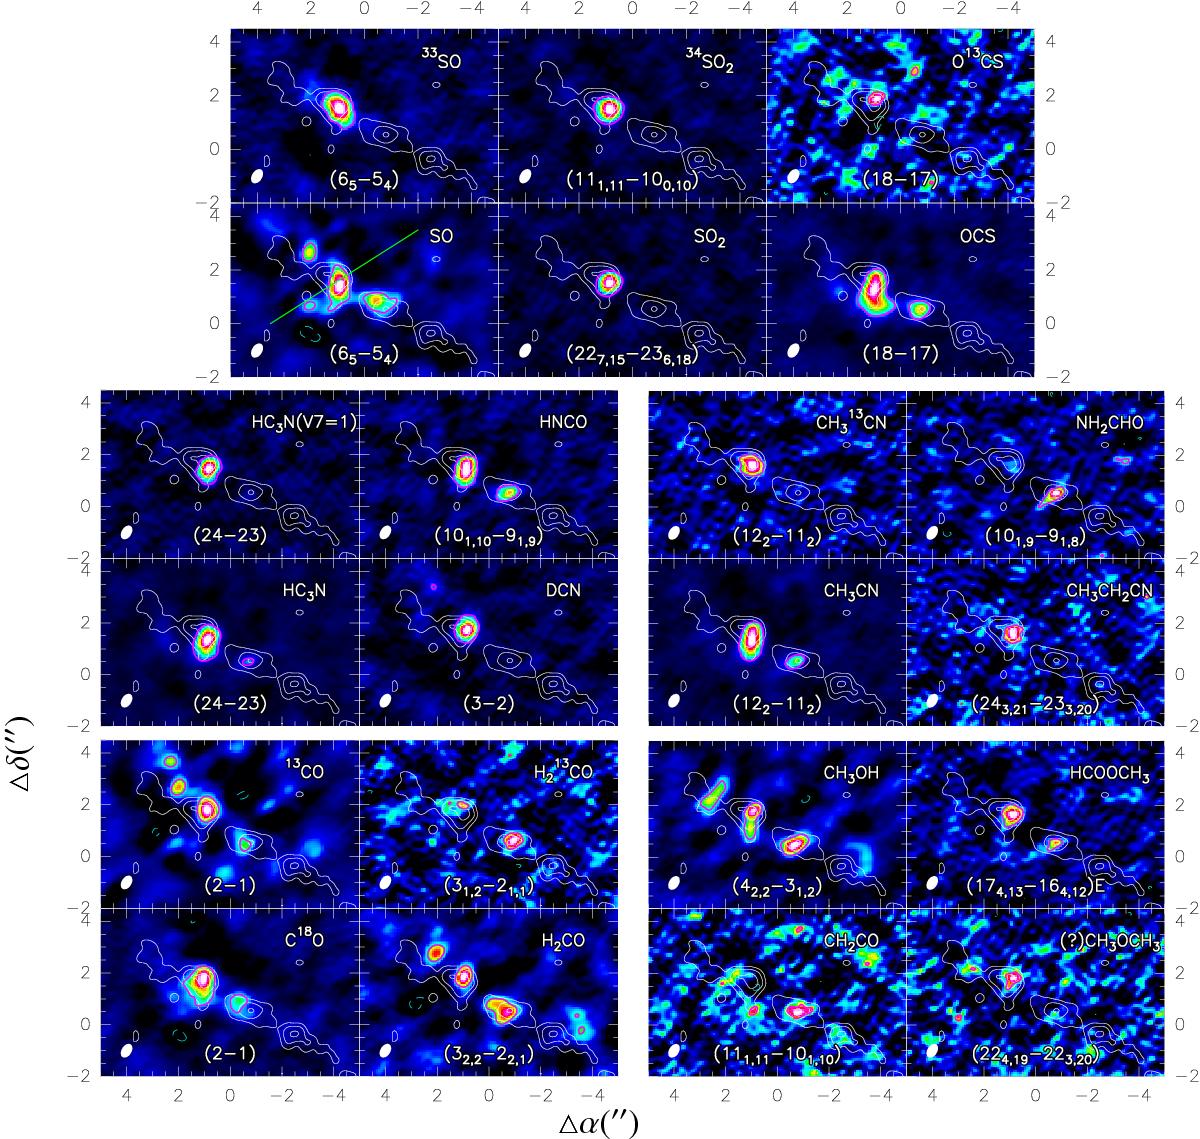
Maps of the strongest line from each isotopologue detected in PdBI observations at 1.37 mm. The intensities have been derived by integrating the line emission over the velocity range shown in Fig. . The synthetic beam is shown at the bottom left of each panel. White contours show the continuum (at 4σ, 14σ, and 24σ levels with σ = 0.94 m Jy beam-1), purple contour reveals the region where molecular specific intensity >3σ, and the dashed green contour reveals the negative specific intensity beyond −3σ because of the interferometric side lobe effect. Green lines in the SO map sketch the outflow directions. All images have different color scales (in mJy beam-1 km s-1), increasing from black to white, which are optimized to emphasize the features in the distribution of each line.
Current usage metrics show cumulative count of Article Views (full-text article views including HTML views, PDF and ePub downloads, according to the available data) and Abstracts Views on Vision4Press platform.
Data correspond to usage on the plateform after 2015. The current usage metrics is available 48-96 hours after online publication and is updated daily on week days.
Initial download of the metrics may take a while.