Fig. A.2
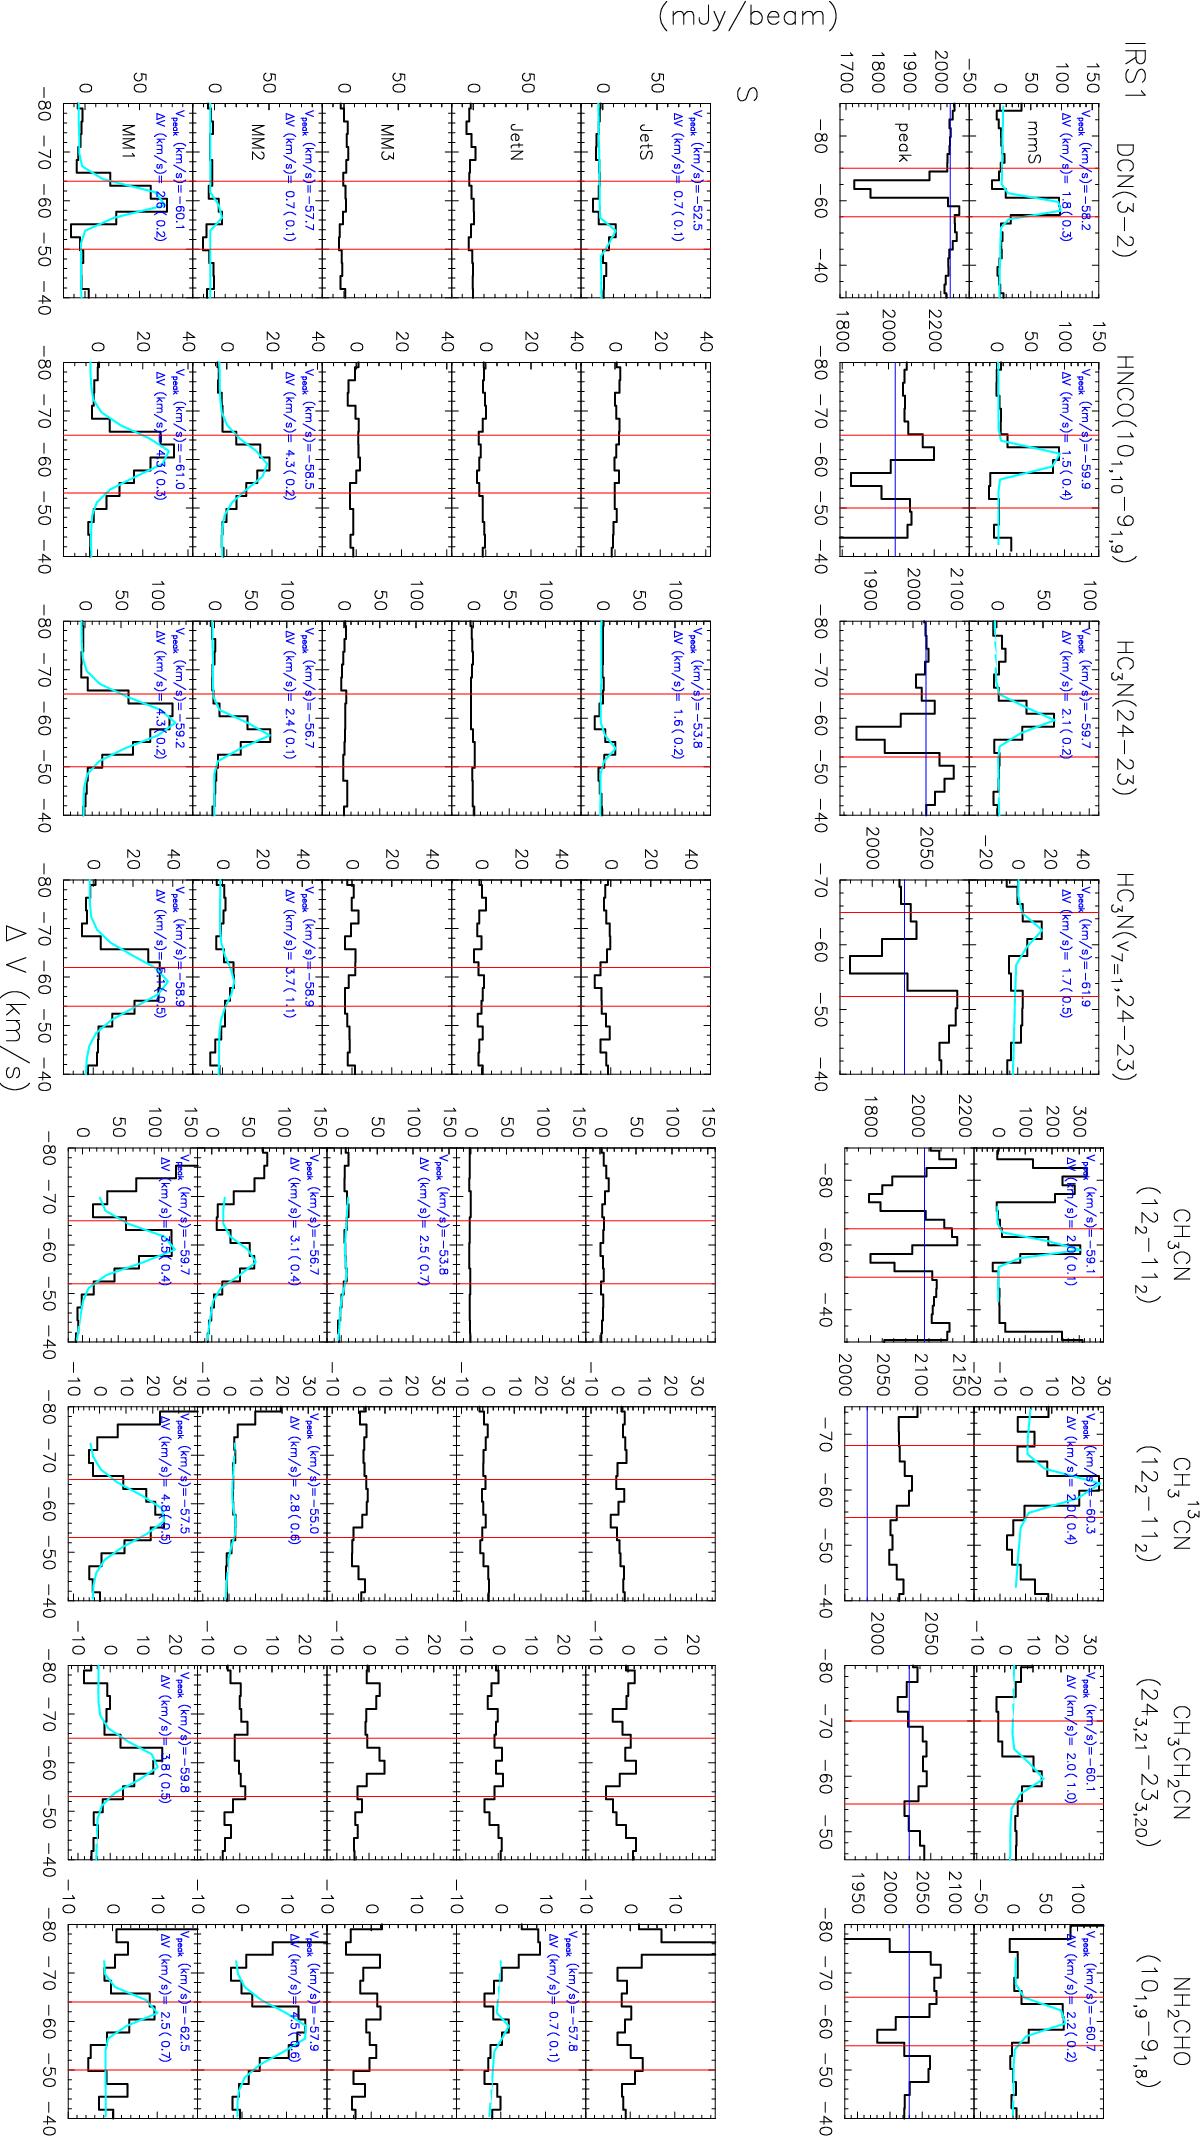
Line profiles of identified species (in black) and single Gaussian fits (in blue) toward the continuum substructures identified in this paper(given in Table 1). Continuum is not subtracted in IRS1. Two red vertical lines in each panel mark the velocity range we use to integrate the intensity and obtain the spatial distribution maps (Fig. 3). Lines marked with “**” has >4σ detection but could not be fitted with a singleGaussian. “∇∇” denotes the lines having >4σ detection butshowing obvious absorption in IRS1-mmS or obvious emission in IRS1-peak.
Current usage metrics show cumulative count of Article Views (full-text article views including HTML views, PDF and ePub downloads, according to the available data) and Abstracts Views on Vision4Press platform.
Data correspond to usage on the plateform after 2015. The current usage metrics is available 48-96 hours after online publication and is updated daily on week days.
Initial download of the metrics may take a while.