Fig. 1
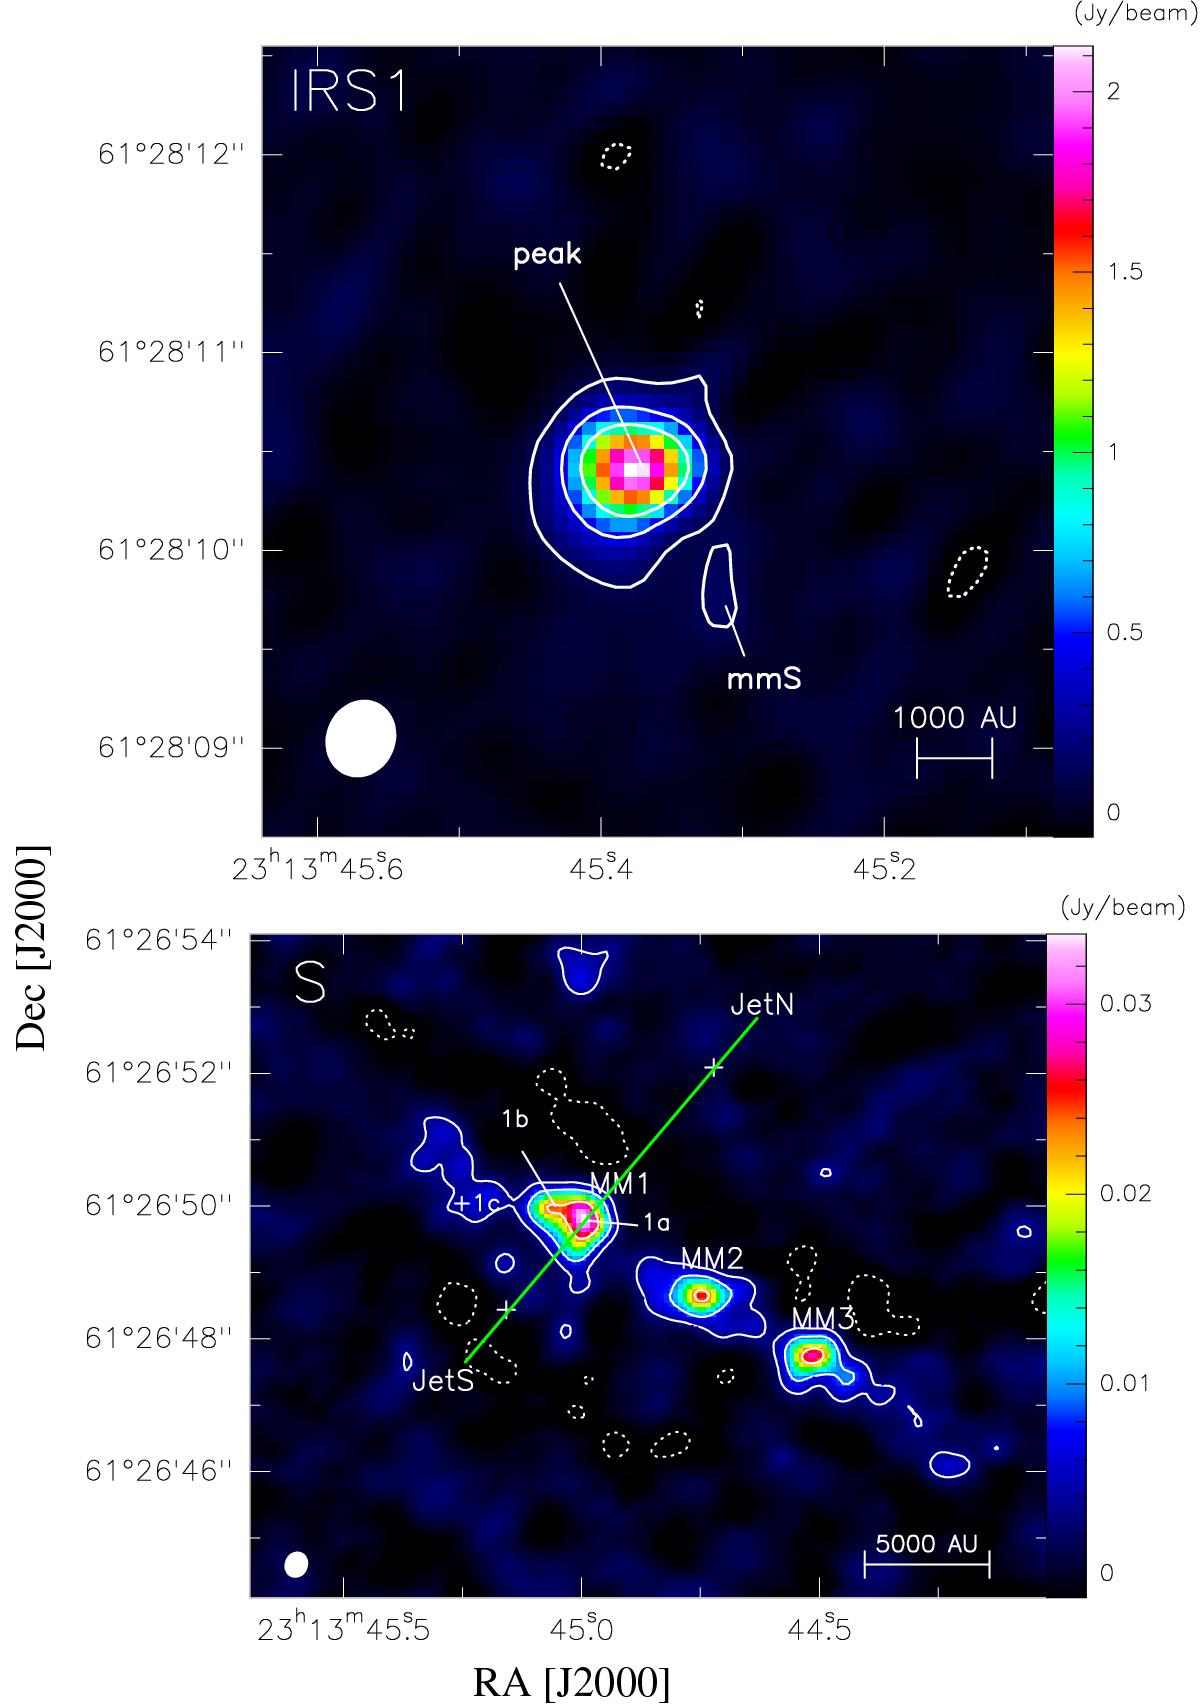
Colormaps and contours of the continuum emission obtained with the PdBI at 1.37 mm. Line emission was removed for NGC 7538 S and shown to be negligible for IRS1 (see text). For IRS1 (upper panel), the white solid contours start at 5σ and continue in 20σ steps (σ = 22 mJy beam-1). For NGC 7538 S (lower panel), the contour levels start at 4σ and continue in 10σ steps (σ = 0.94 m Jy beam-1). Dashed contours represent negative emission at the same level as the solid (positive) contours. The synthesized beams are shown at the bottom left of each panel. The direction of the studied outflow is shown with a green line. Labels mark individual substructures we identified.
Current usage metrics show cumulative count of Article Views (full-text article views including HTML views, PDF and ePub downloads, according to the available data) and Abstracts Views on Vision4Press platform.
Data correspond to usage on the plateform after 2015. The current usage metrics is available 48-96 hours after online publication and is updated daily on week days.
Initial download of the metrics may take a while.