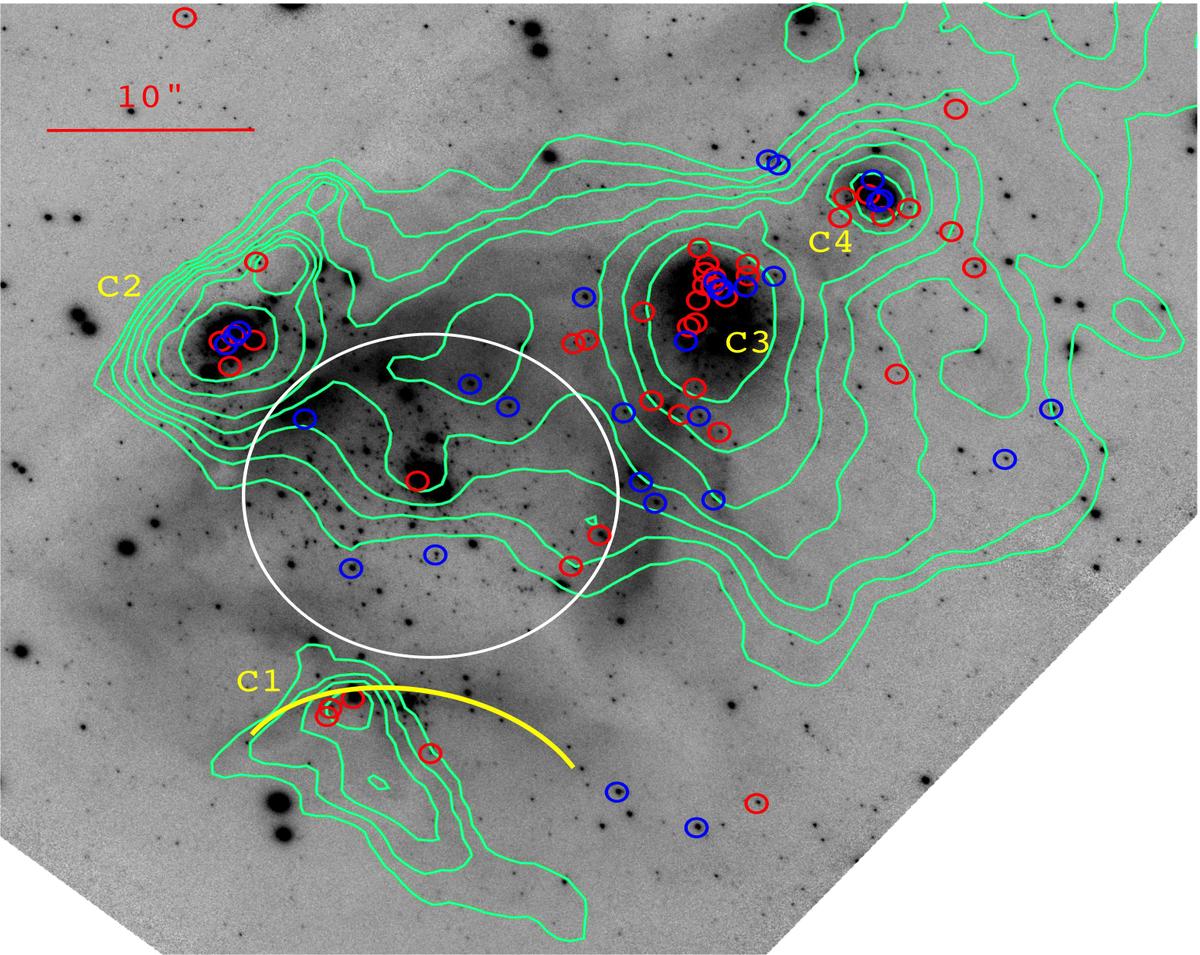
Fig. 7
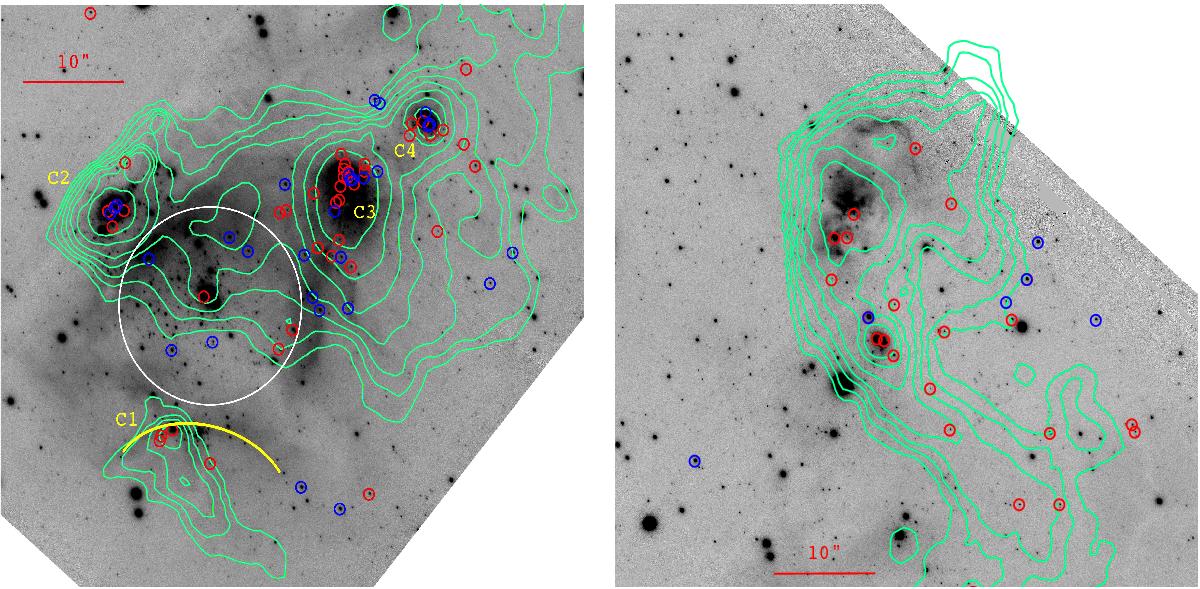
Locations of the candidate YSOs in the GeMS/GSAOI Ks-band image, compared with the intensity of 8 μm emission from Spitzer observations (green contours, Jones et al. 2005); north is up and east is left. The blue circles show YSO candidates from analysis of the colour−colour diagram, red circles are those from analysis of the colour−magnitude diagram, see text for details. The left-hand panel shows the region around the central cluster (indicated by the white circle), with the yellow arc showing the location of an apparently limb-brightended rim; the right-hand panel shows the region around the C5 compact clump.
Current usage metrics show cumulative count of Article Views (full-text article views including HTML views, PDF and ePub downloads, according to the available data) and Abstracts Views on Vision4Press platform.
Data correspond to usage on the plateform after 2015. The current usage metrics is available 48-96 hours after online publication and is updated daily on week days.
Initial download of the metrics may take a while.