Fig. 6
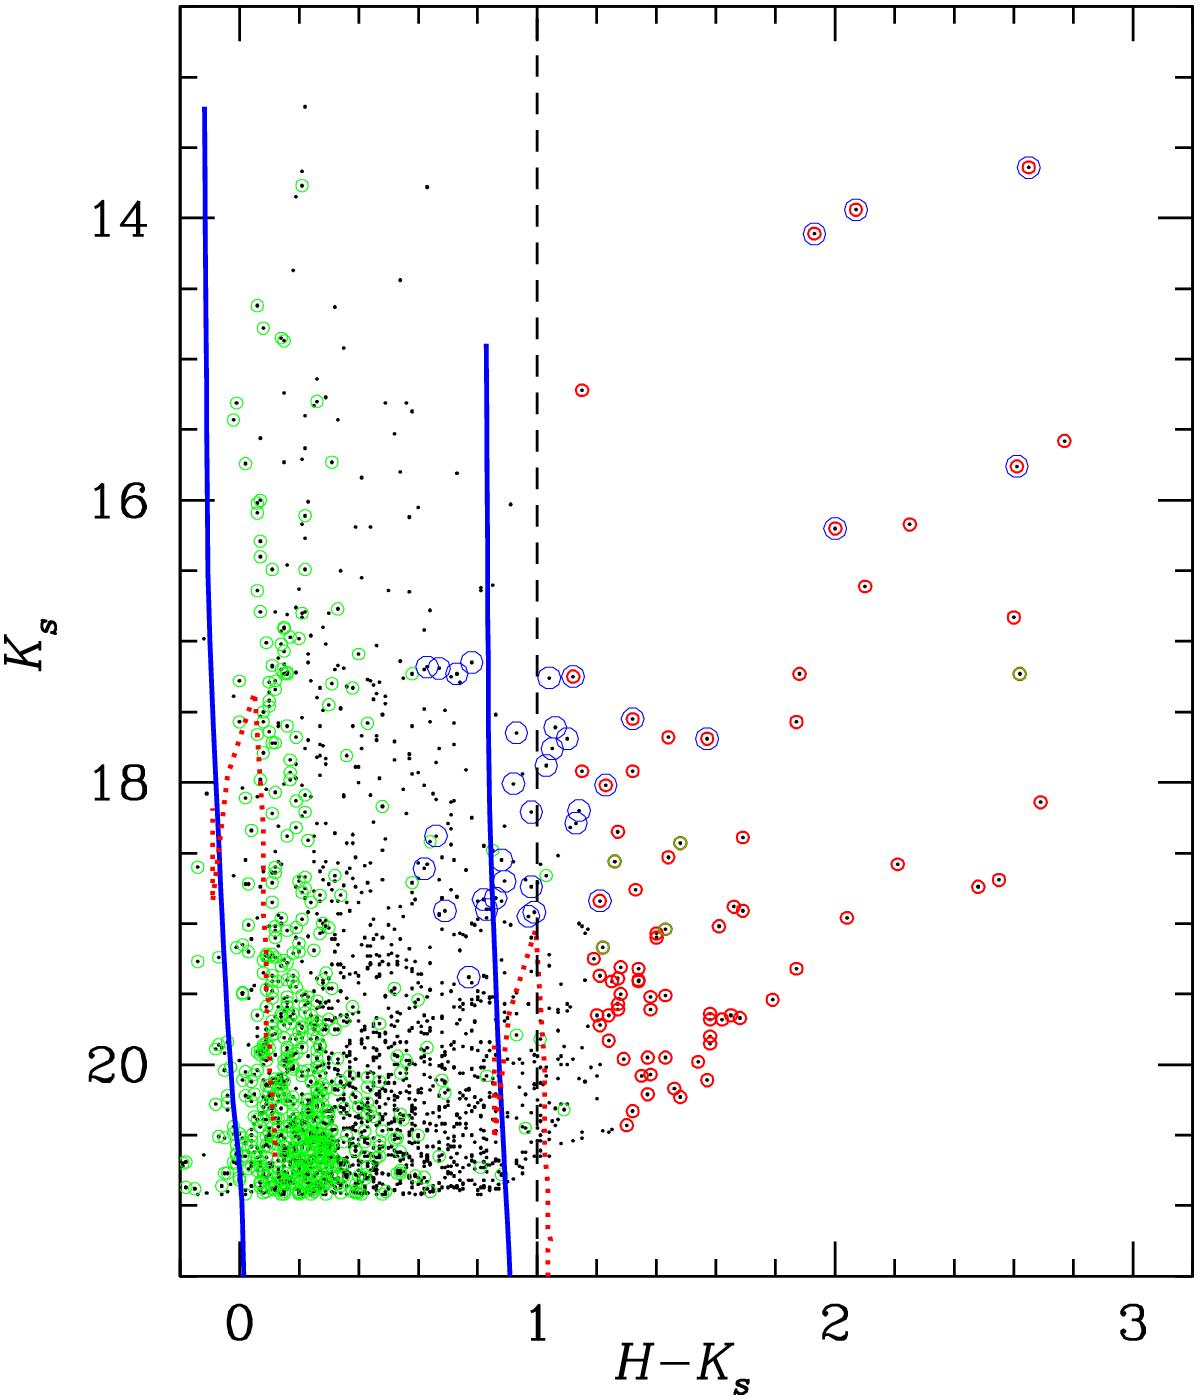
Colour−magnitude diagram of sources in N159W detected in only the H- and Ks-bands (black points) and those in the control field (black points with green circles). Also plotted are the zero-age main sequence (solid blue lines) and the 1 Myr PMS isochrone from Siess et al. (2000, dotted red lines) for extinctions of AV = 0 and 15 mag. Red circles highlight candidate YSOs identified from our colour cut (see text for details). Blue circles highlight candidate YSOs previously identified from the CCD (Fig. 5).
Current usage metrics show cumulative count of Article Views (full-text article views including HTML views, PDF and ePub downloads, according to the available data) and Abstracts Views on Vision4Press platform.
Data correspond to usage on the plateform after 2015. The current usage metrics is available 48-96 hours after online publication and is updated daily on week days.
Initial download of the metrics may take a while.