Fig. 5
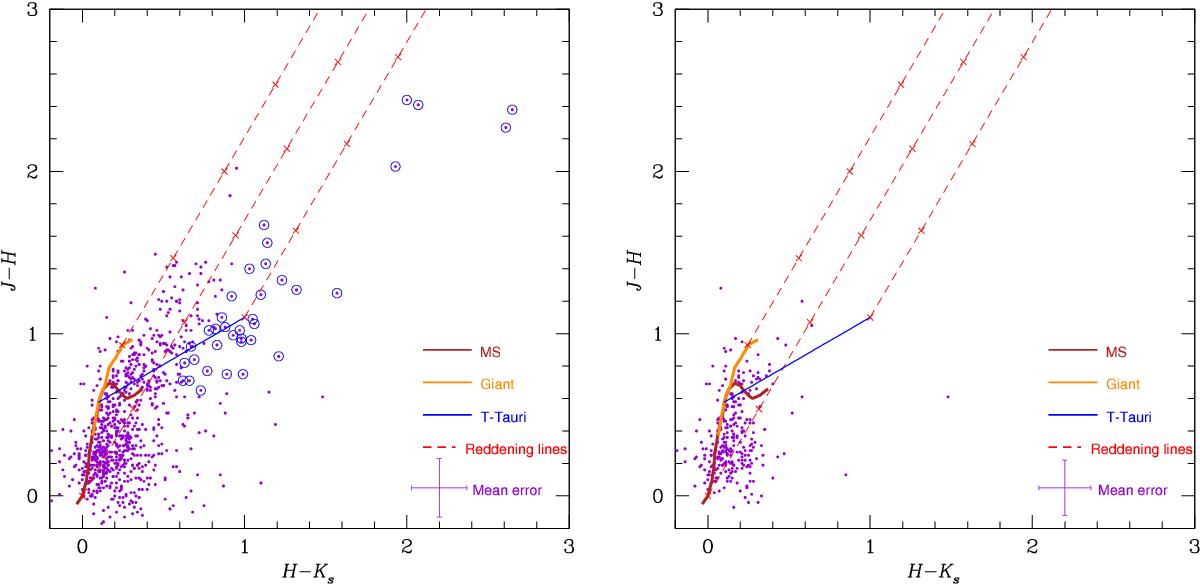
Colour−colour diagrams for the cluster region in N159W (left-hand panel) and the control region (right), with the loci of the main sequence (MS), giant branch, and T Tauri stars (TTS) overlaid in red, orange and blue, respectively. Also shown are reddening vectors (dashed red lines) drawn from the tip of the giant brach (left), from the base of the MS (middle), and from the reddest TTS (right). Cluster sources with a NIR excess are indicated in the left-hand panel by the blue circles. The error bars in the lower-right corner show the average uncertainties in the colour terms.
Current usage metrics show cumulative count of Article Views (full-text article views including HTML views, PDF and ePub downloads, according to the available data) and Abstracts Views on Vision4Press platform.
Data correspond to usage on the plateform after 2015. The current usage metrics is available 48-96 hours after online publication and is updated daily on week days.
Initial download of the metrics may take a while.