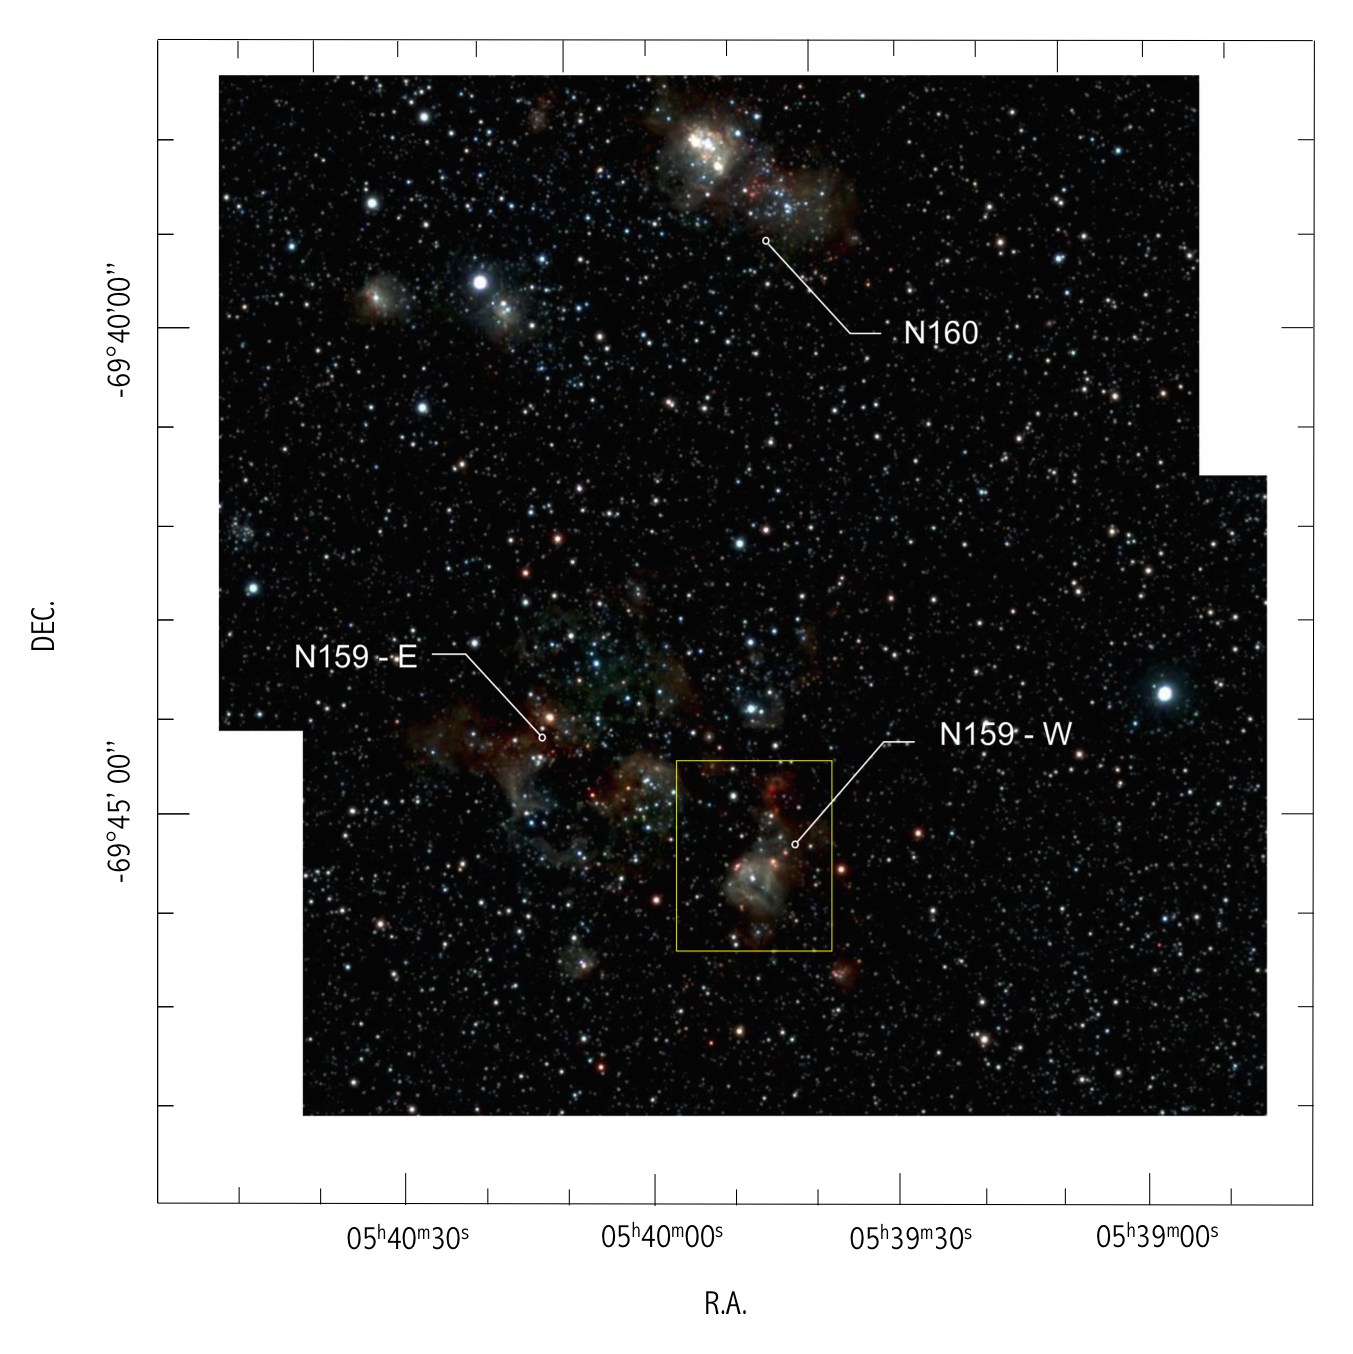
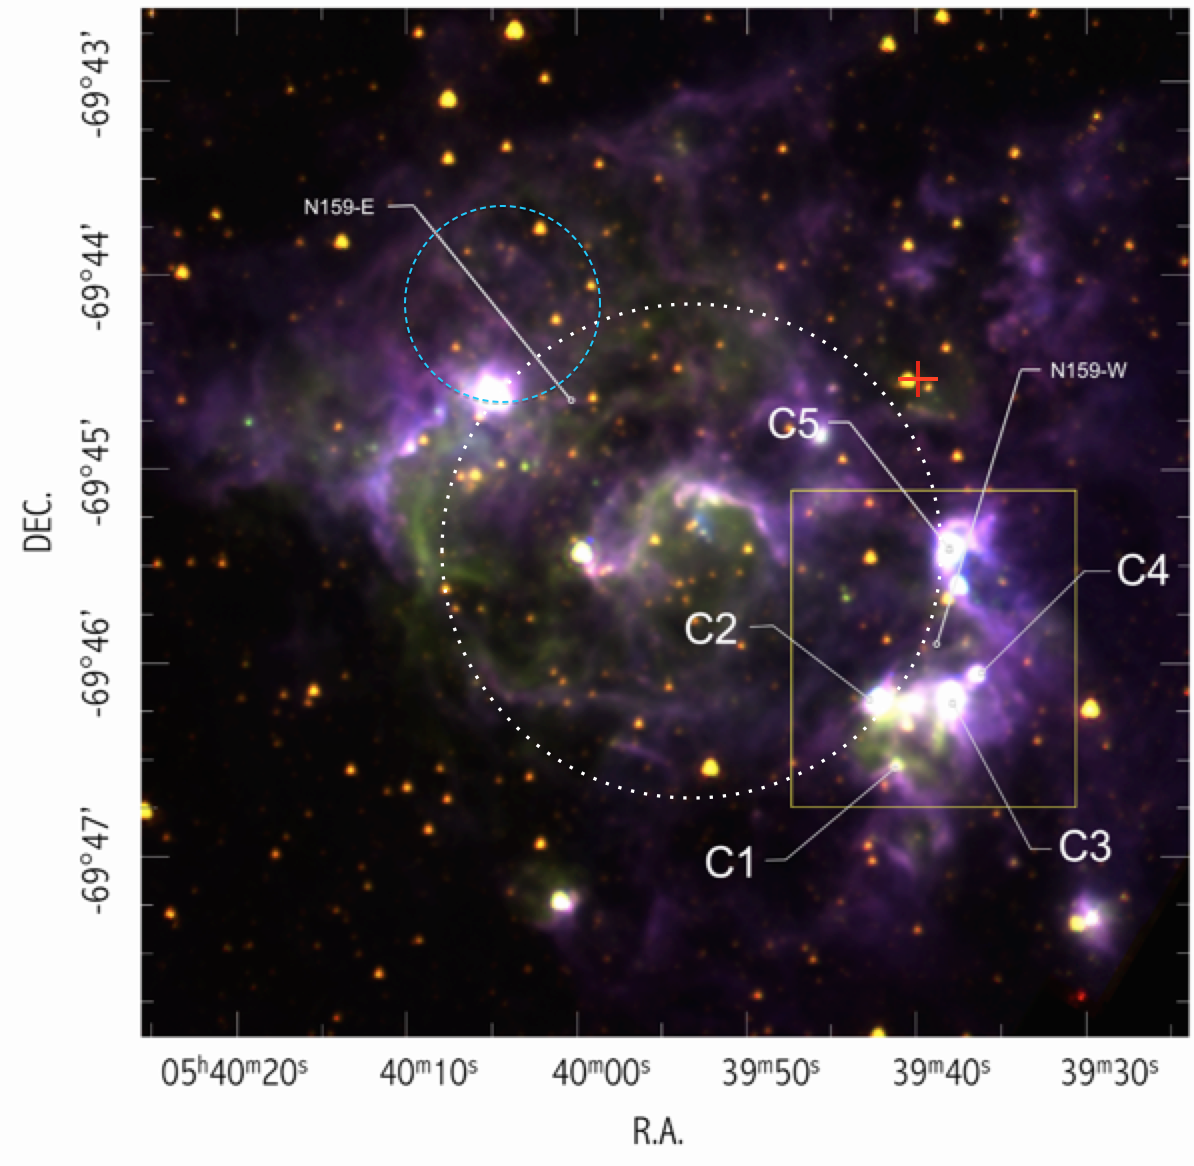
Fig. 1
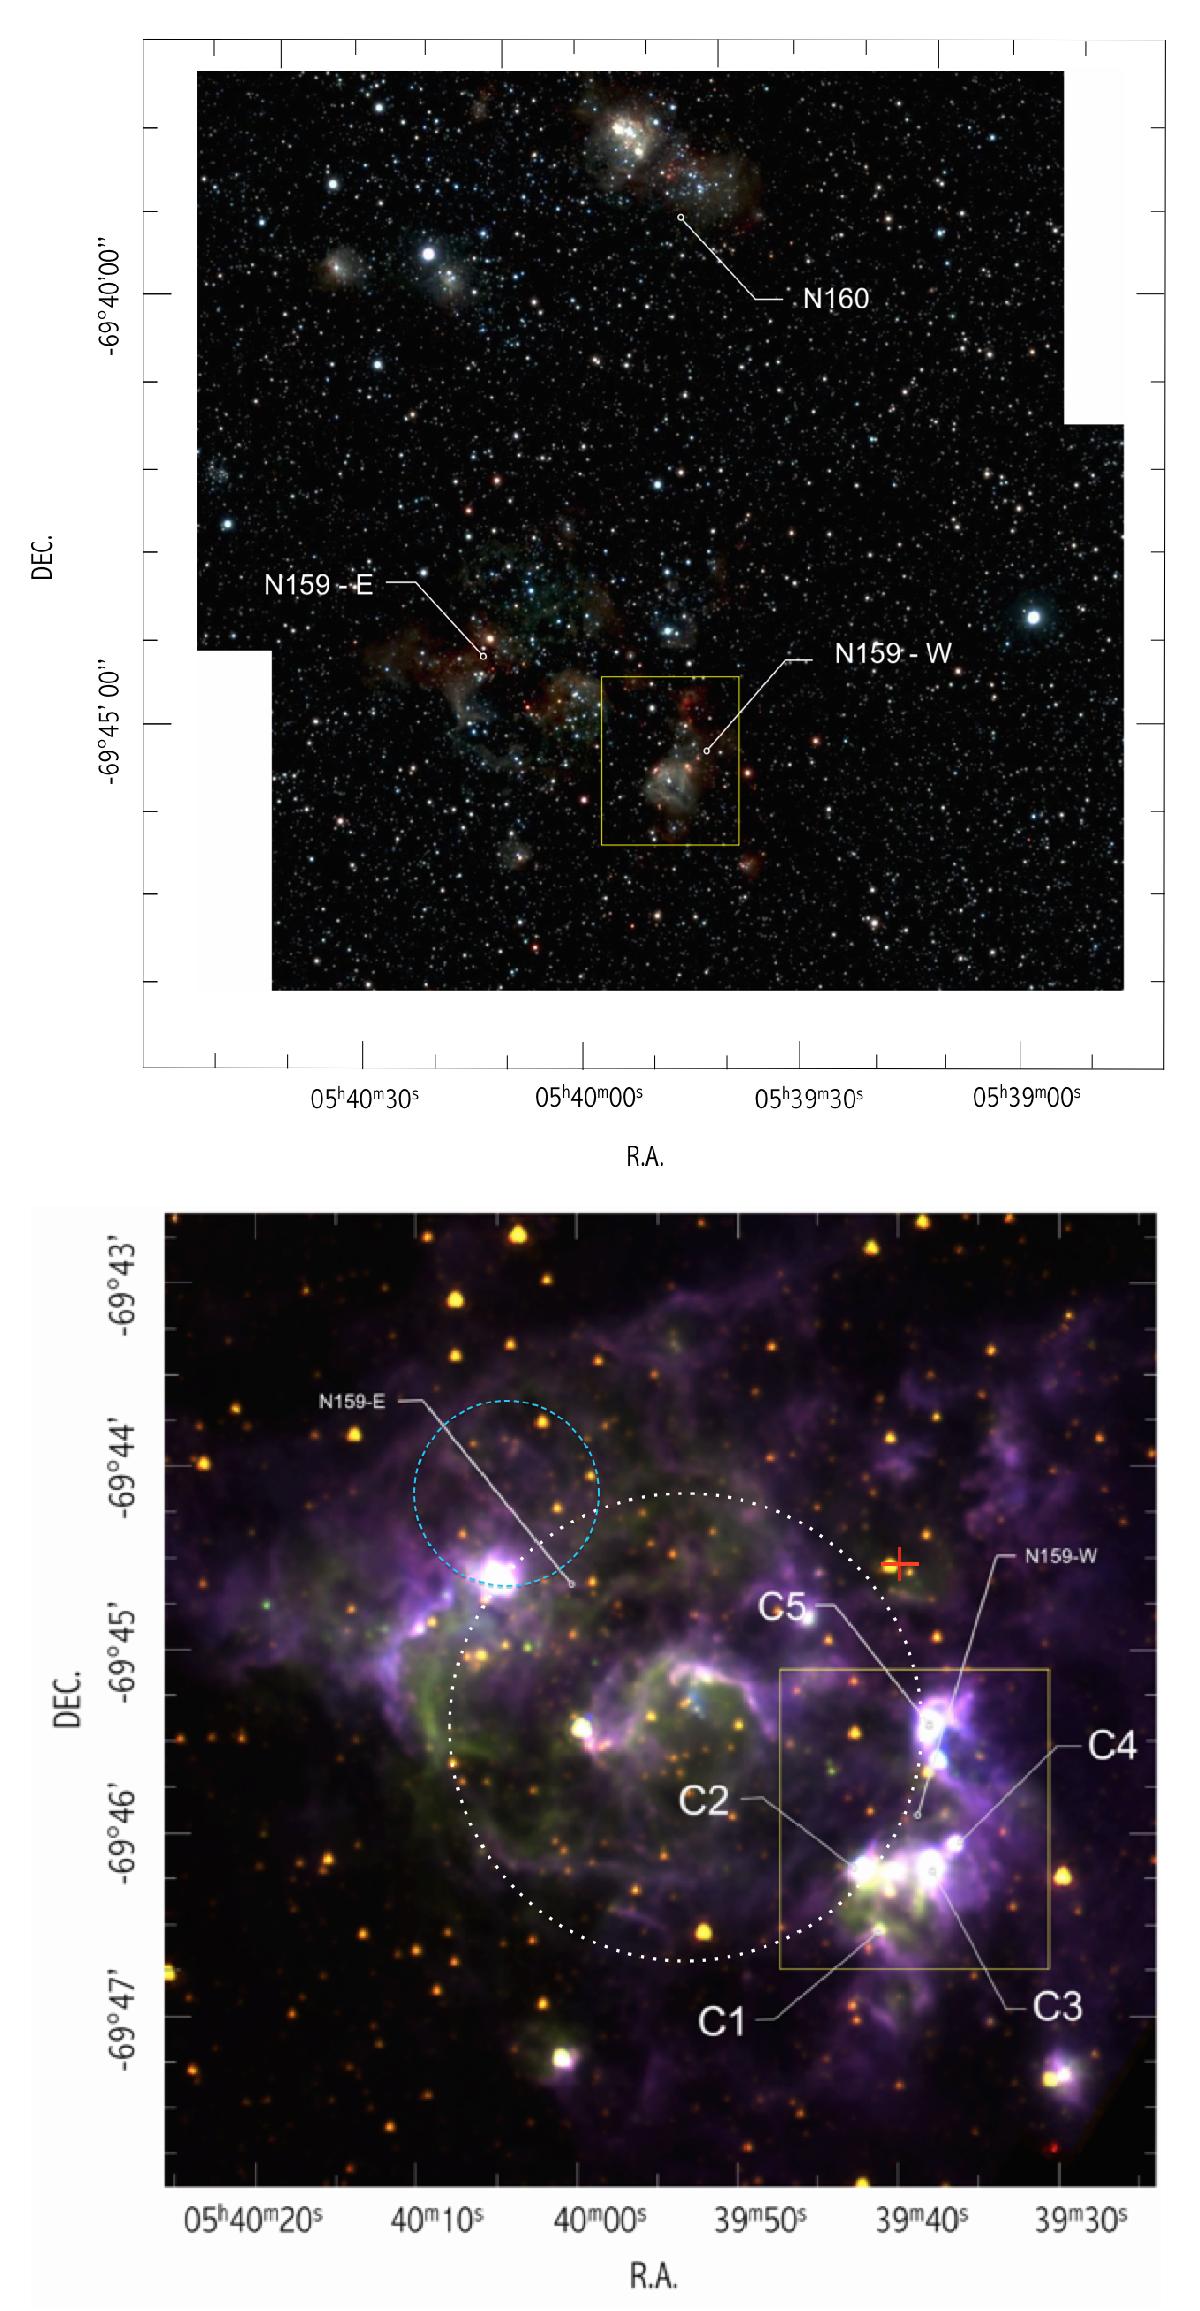
Overview of the N159/N160 complex. Top: composite VISTA image (Cioni et al. 2011), combining Y (blue), J (green) and Ks (red) bands. Bottom: composite Spitzer image of N159E and N159W, combining 3.6 μm (blue), 4.5 μm (green) and 8 μm (red). The N159W field targetted by GeMS/GSAOI is shown by the yellow square. Compact clusters discussed in the paper are labelled C1-C5. The positions of the close X-ray binary LMC X-1 and the SNR 0540−697 (Chen et al. 2010) are marked in dash-dotted cyan line and red cross respectively.
Current usage metrics show cumulative count of Article Views (full-text article views including HTML views, PDF and ePub downloads, according to the available data) and Abstracts Views on Vision4Press platform.
Data correspond to usage on the plateform after 2015. The current usage metrics is available 48-96 hours after online publication and is updated daily on week days.
Initial download of the metrics may take a while.