Fig. 12
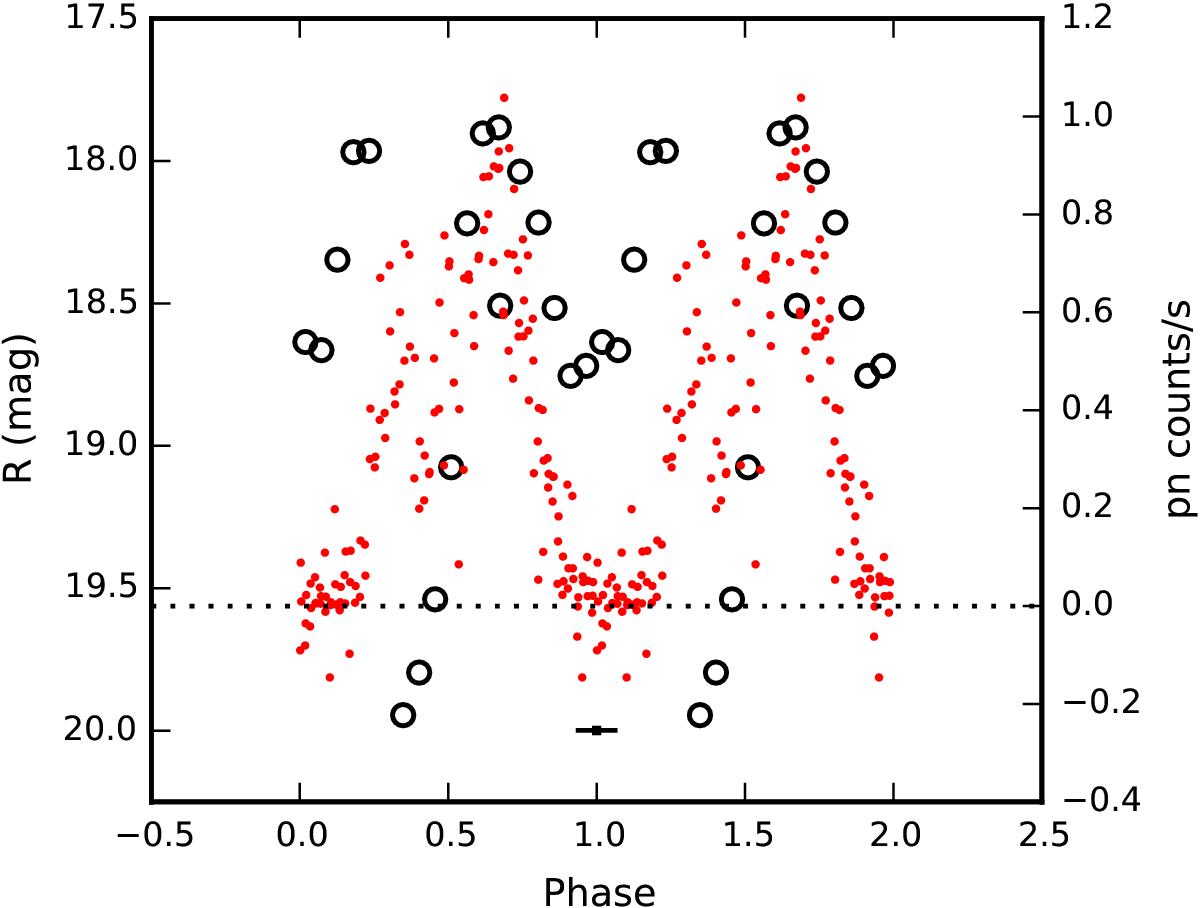
Approximate Johnson R-band light curves derived from time-resolved spectrophotometric observations of J1730 on August 13, 2013 (large circles) and phase-folded EPIC-pn count rates (small points). The cycle is plotted twice for clarity. The horizontal error bar indicates the maximum accumulated phase uncertainty between the optical and X-ray observations. The dotted horizontal line indicates zero pn count rate.
Current usage metrics show cumulative count of Article Views (full-text article views including HTML views, PDF and ePub downloads, according to the available data) and Abstracts Views on Vision4Press platform.
Data correspond to usage on the plateform after 2015. The current usage metrics is available 48-96 hours after online publication and is updated daily on week days.
Initial download of the metrics may take a while.