Fig. 11
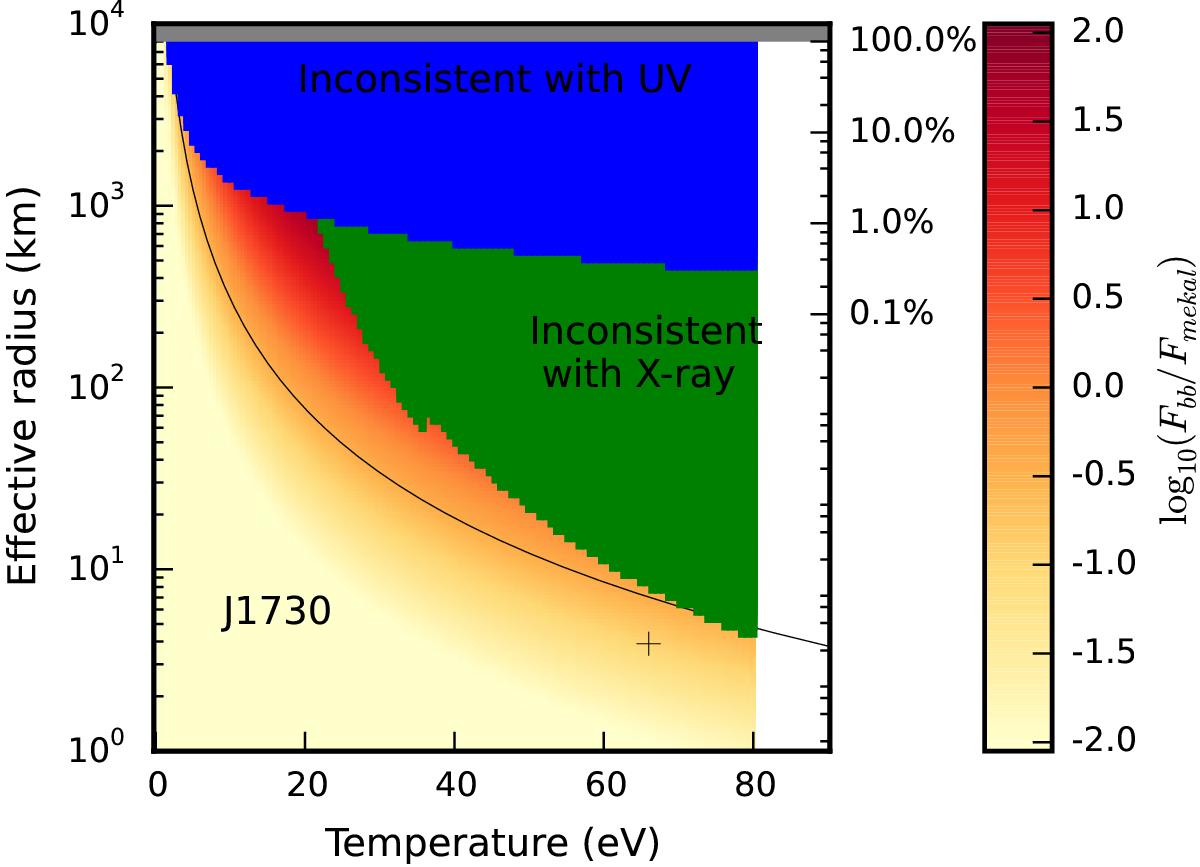
Parameter space in which a soft excess can exist for J1730. The green regions indicate areas excluded because they conflict with the XMM-Newton X-ray observations, the blue region indicates areas ruled out because they overpredict the UVW1 energy density, and the grey region indicates an emitting area larger than the surface of the assumed 8000 km radius WD. The shaded region indicates the magnitude of the potential soft excess (i.e. its flux divided by that of the X-ray plasma component). The black curve tracks where these are equal, indicating what would be expected for a bremsstrahlung being half intercepted and re-radiated. The right y-axis expresses the emitting area as a percentage of the WD surface. The black cross shows the location of the soft blackbody we actually detected in this spectrum, and the diamond indicates the most luminous blackbody for a nearer (560 pc) distance.
Current usage metrics show cumulative count of Article Views (full-text article views including HTML views, PDF and ePub downloads, according to the available data) and Abstracts Views on Vision4Press platform.
Data correspond to usage on the plateform after 2015. The current usage metrics is available 48-96 hours after online publication and is updated daily on week days.
Initial download of the metrics may take a while.