Free Access
Fig. A.1
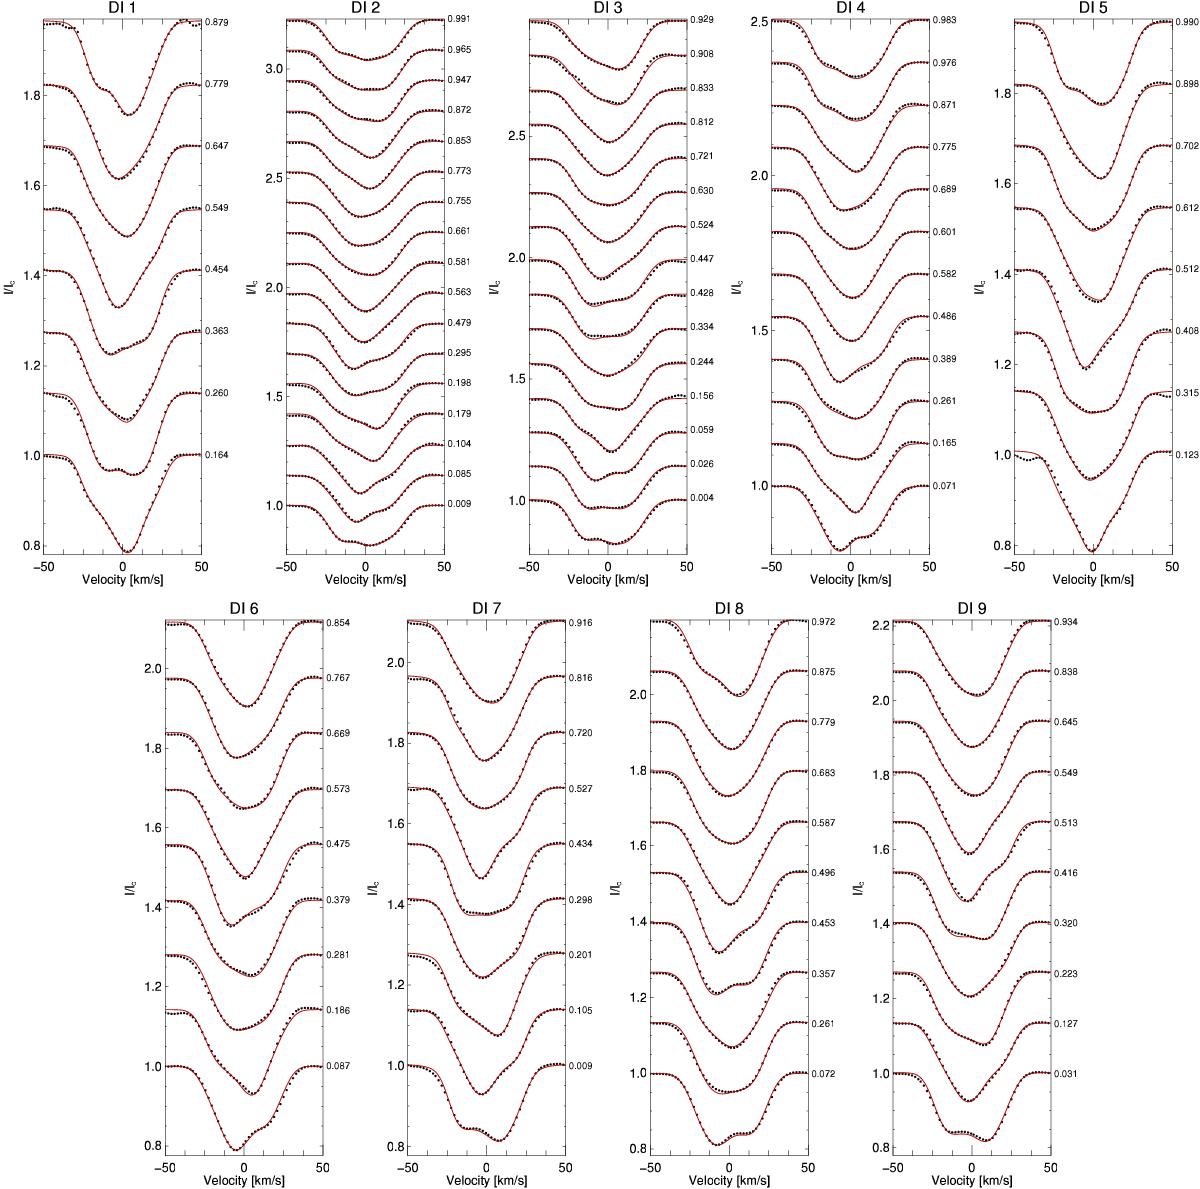
Line profiles used for nine Doppler images. Each figure shows the observed (dotted lines) and inverted (solid red lines) profiles for one Doppler image, stating the number of the image and respective phases. Rotation advances from bottom to top.
This figure is made of several images, please see below:
Current usage metrics show cumulative count of Article Views (full-text article views including HTML views, PDF and ePub downloads, according to the available data) and Abstracts Views on Vision4Press platform.
Data correspond to usage on the plateform after 2015. The current usage metrics is available 48-96 hours after online publication and is updated daily on week days.
Initial download of the metrics may take a while.