Fig. 5
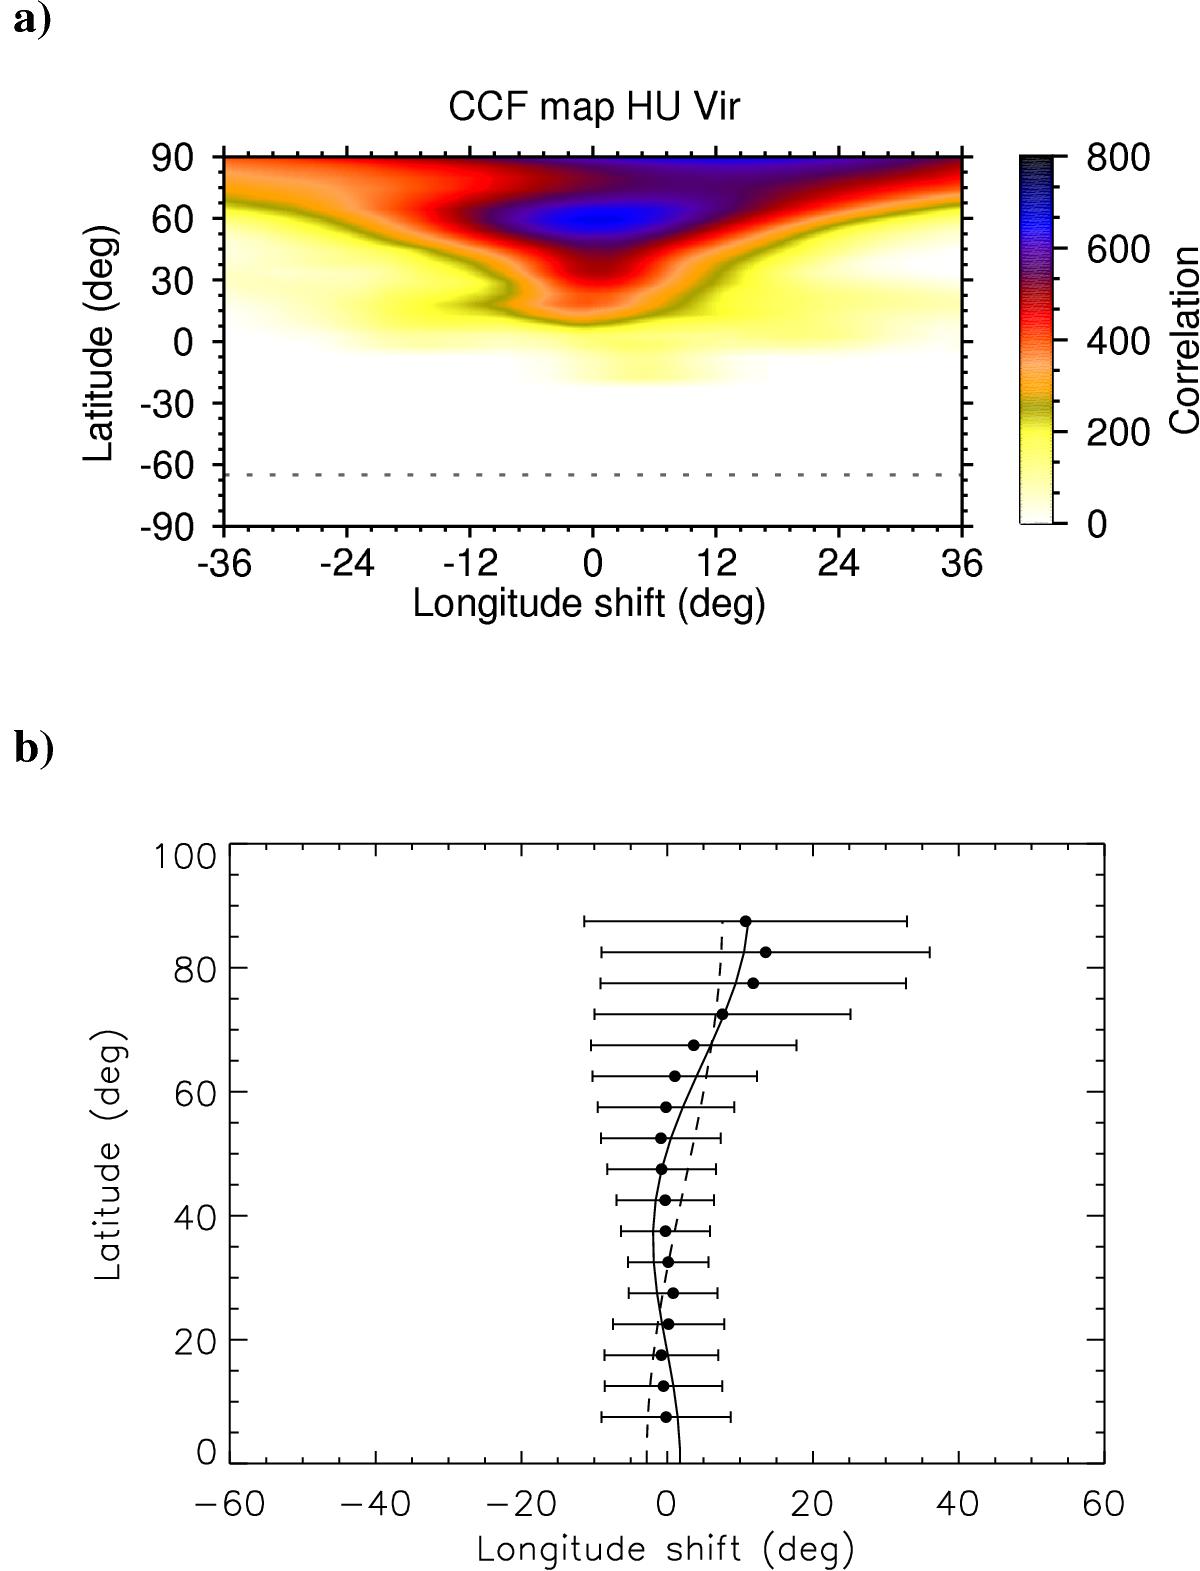
Differential rotation signature. a) Average cross-correlation-function map. The shade (color) scales with the correlation. b) Correlation fits per latitude. Dots are the correlation peaks per 5°-latitude bin. The error bars are defined as the FWHM of the corresponding Gaussian fits. The dashed line represents the DR-fit using Eq. (2) and the solid line is the DR-fit using Eq. (3).
Current usage metrics show cumulative count of Article Views (full-text article views including HTML views, PDF and ePub downloads, according to the available data) and Abstracts Views on Vision4Press platform.
Data correspond to usage on the plateform after 2015. The current usage metrics is available 48-96 hours after online publication and is updated daily on week days.
Initial download of the metrics may take a while.