Free Access
Fig. 1
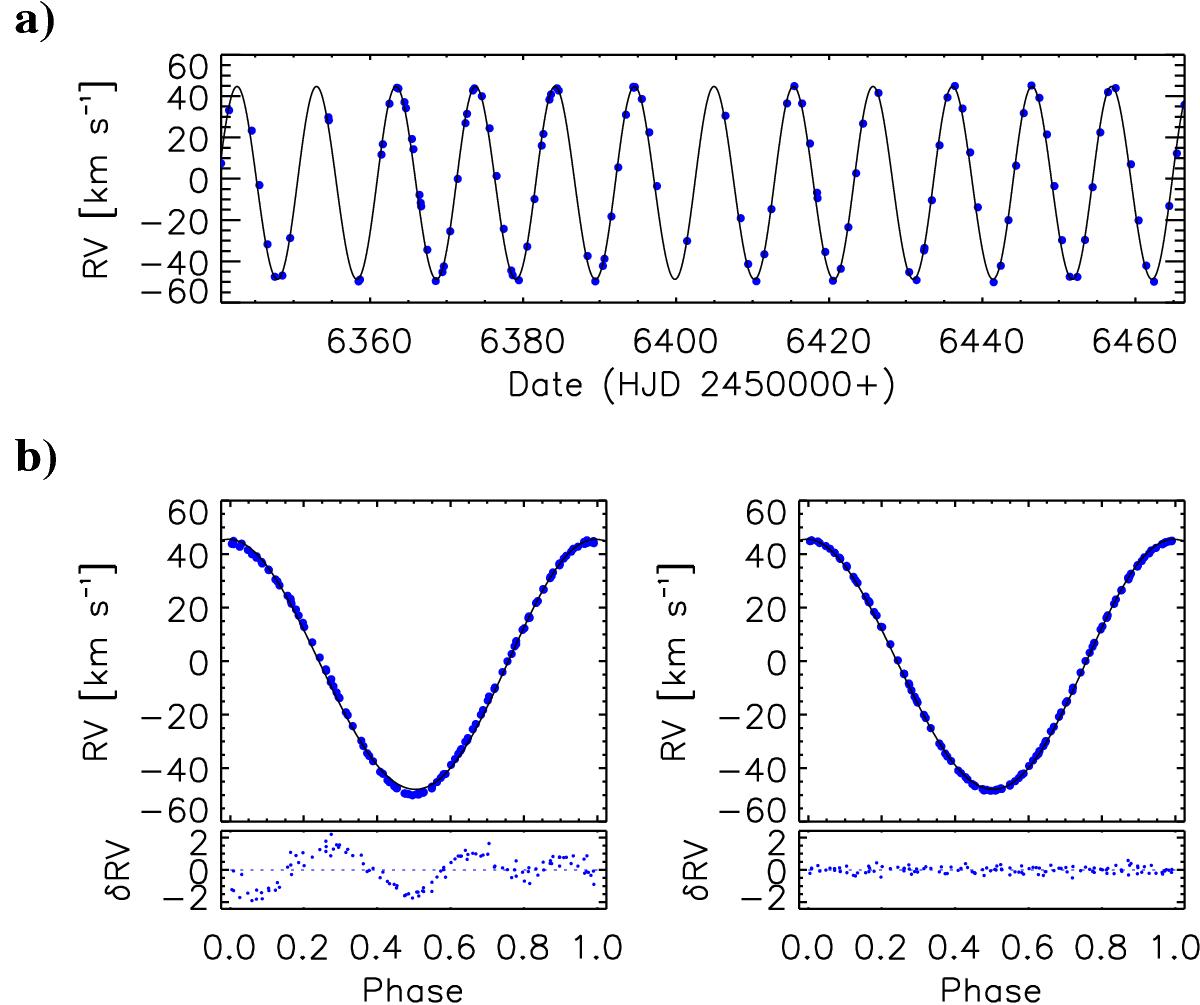
STELLA radial velocities of HU Vir. a) The entire time series obtained during February through June 2013. b) The phased RV curve before (left) and after spot-jitter removal (right). The respective lower panels show the O–C residuals. Phases were computed from Eq. (1). The solid line is our final orbit from Table 1.
This figure is made of several images, please see below:

Current usage metrics show cumulative count of Article Views (full-text article views including HTML views, PDF and ePub downloads, according to the available data) and Abstracts Views on Vision4Press platform.
Data correspond to usage on the plateform after 2015. The current usage metrics is available 48-96 hours after online publication and is updated daily on week days.
Initial download of the metrics may take a while.