Fig. 9
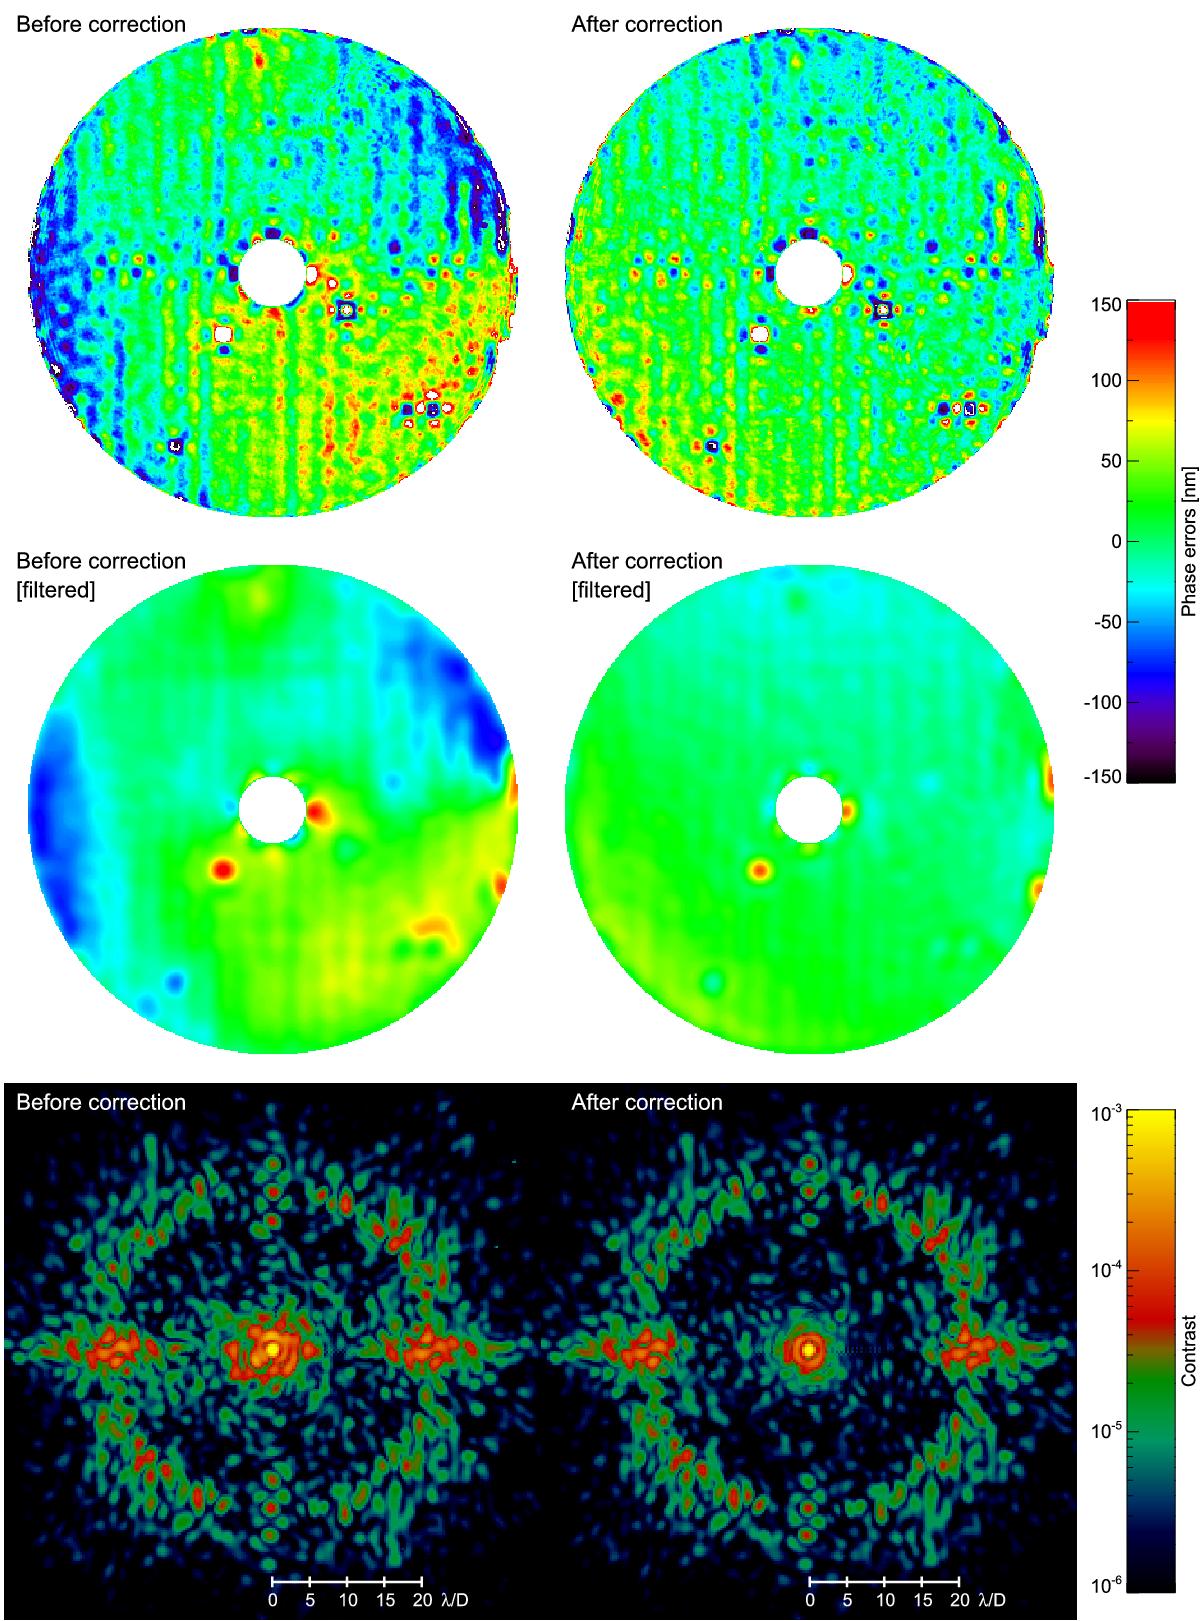
Illustration of the correction of the SPHERE NCPA using ZELDA measurements with IRDIS. The top row shows the OPD maps measured with ZELDA before (left) and after (right) the correction, presented at the same color scale. The middle row shows the same maps filtered in Fourier space using a Hann window of size 25 λ/D (see text). Low spatial frequency aberrations are clearly visible on the left, while they have disappeared after the correction, except for a small amount of residual tip-tilt (see text). The bottom row shows the equivalent focal plane coronagraphic images before (left) and after (right) the compensation of the NCPA, measured at 1593 nm (IRDIS H2 filter) and presented at the same color scale. The gain is obvious close to the center, but also noticeable farther out where the intensity of the speckles in the corrected area has decreased significantly.
Current usage metrics show cumulative count of Article Views (full-text article views including HTML views, PDF and ePub downloads, according to the available data) and Abstracts Views on Vision4Press platform.
Data correspond to usage on the plateform after 2015. The current usage metrics is available 48-96 hours after online publication and is updated daily on week days.
Initial download of the metrics may take a while.