Fig. 8
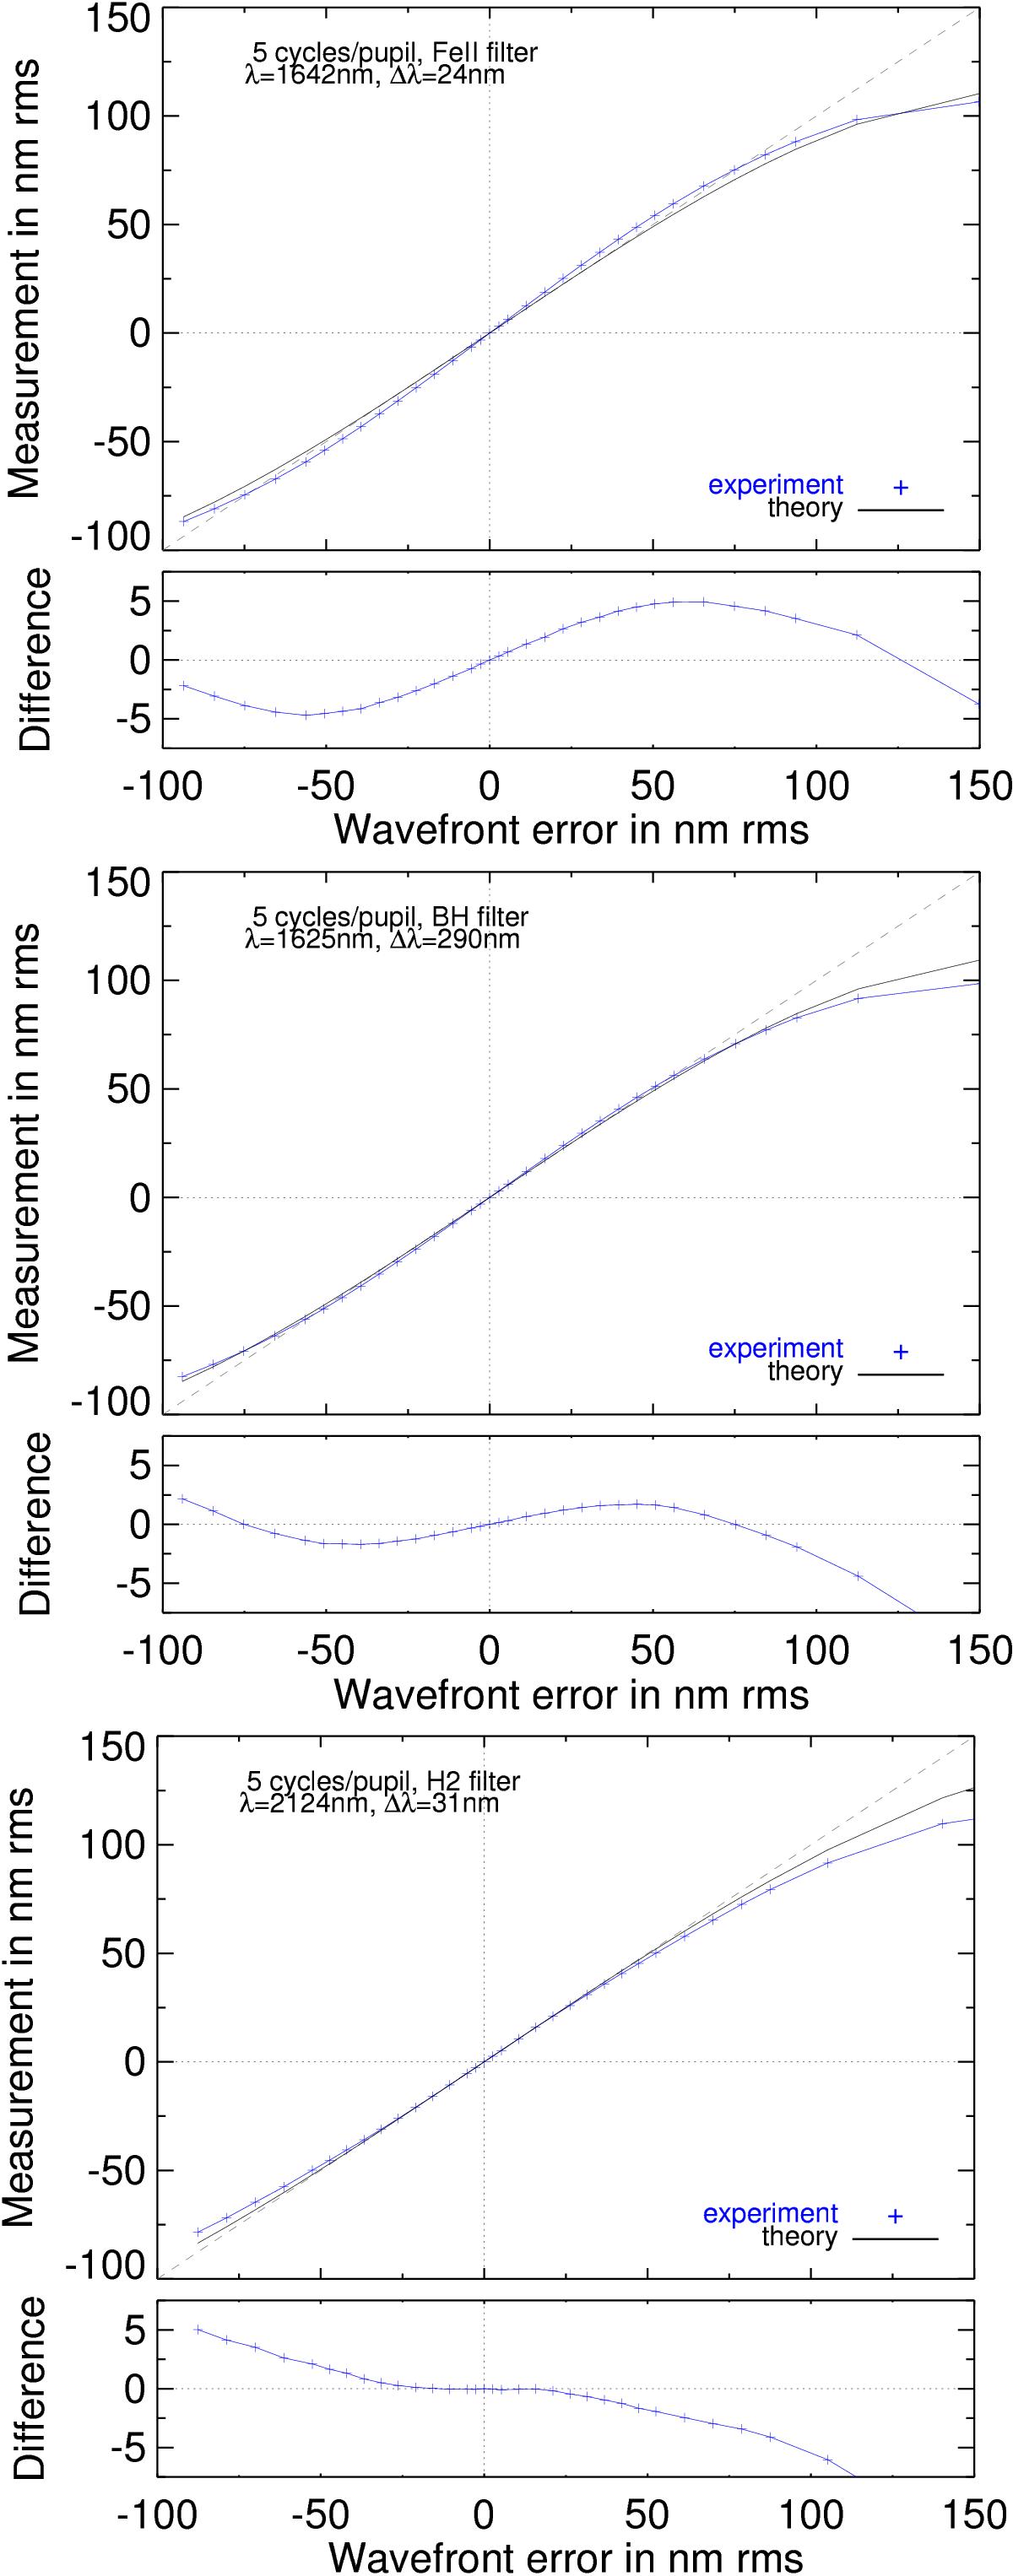
Top plot: response curves of the ZELDA sensor for the Fourier mode with 5 cycles per pupil along the x-axis direction in simulations (black line) and during the experiment on VLT/SPHERE (blue crosses), using Fe ii (top), BH (middle), and H2 (bottom) filters. The characteristics of the filter are summarized in Table 2. Bottom plot: difference between the experiment and the theory.
Current usage metrics show cumulative count of Article Views (full-text article views including HTML views, PDF and ePub downloads, according to the available data) and Abstracts Views on Vision4Press platform.
Data correspond to usage on the plateform after 2015. The current usage metrics is available 48-96 hours after online publication and is updated daily on week days.
Initial download of the metrics may take a while.