Fig. 10
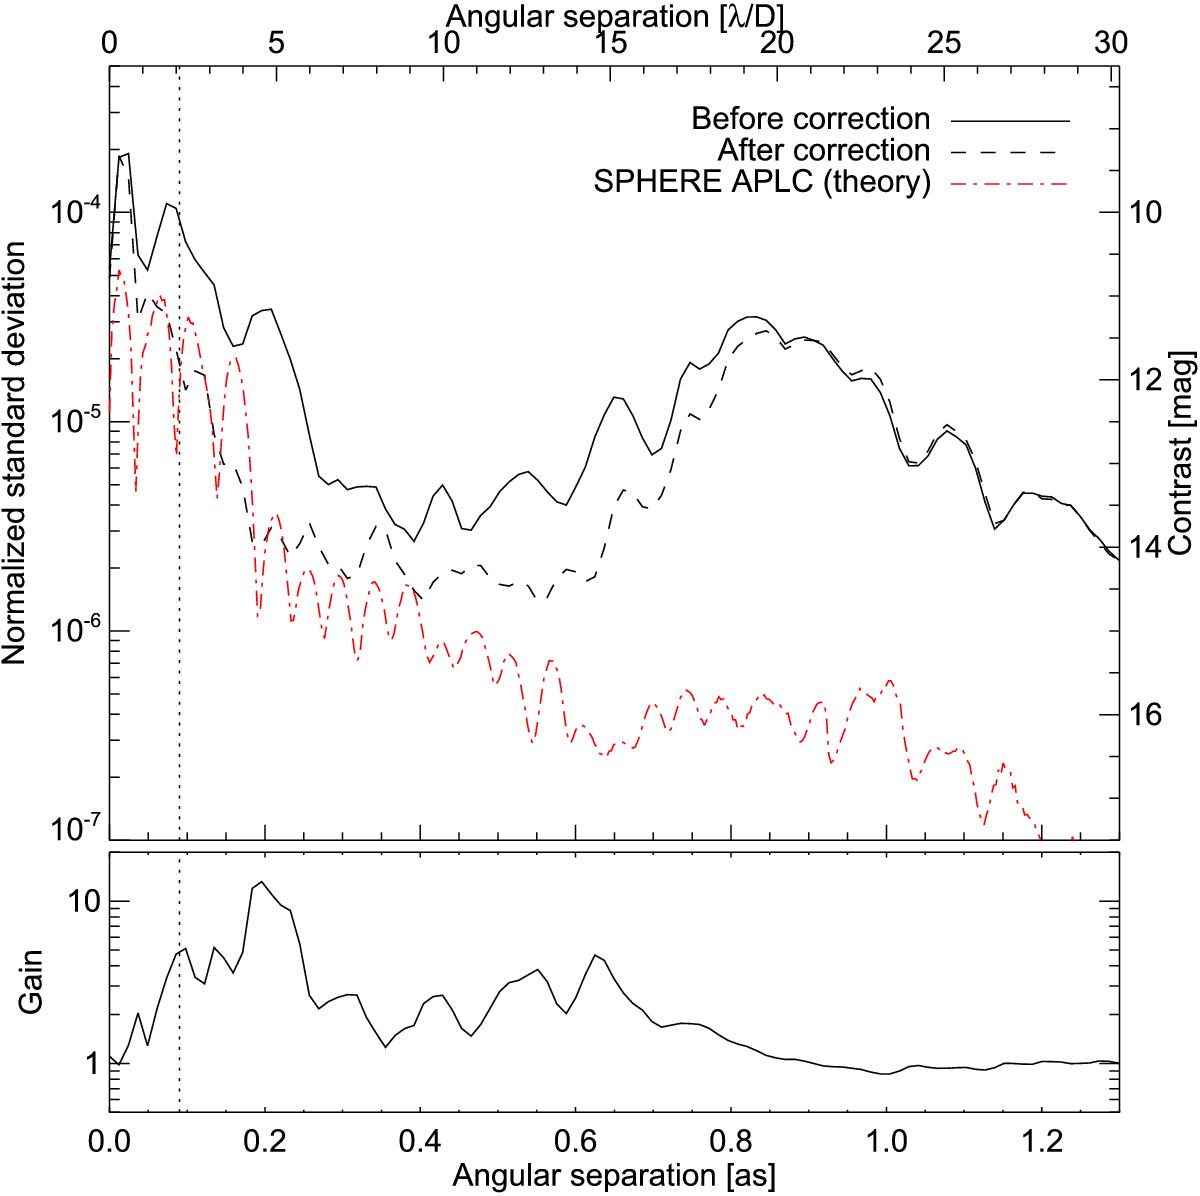
Normalized azimuthal standard deviation profiles before (plain line) and after (dashed line) correction of the NCPA using ZELDA, as a function of angular separation. The contrast gain is plotted in the bottom panel. The dotted line corresponds to the edge of the coronagraphic mask (90 mas). The measurements correspond to the coronagraphic images presented in Fig. 9. They are compared to the theoretical performance of the SPHERE APLC (red, dash-dotted line).
Current usage metrics show cumulative count of Article Views (full-text article views including HTML views, PDF and ePub downloads, according to the available data) and Abstracts Views on Vision4Press platform.
Data correspond to usage on the plateform after 2015. The current usage metrics is available 48-96 hours after online publication and is updated daily on week days.
Initial download of the metrics may take a while.