Fig. 8
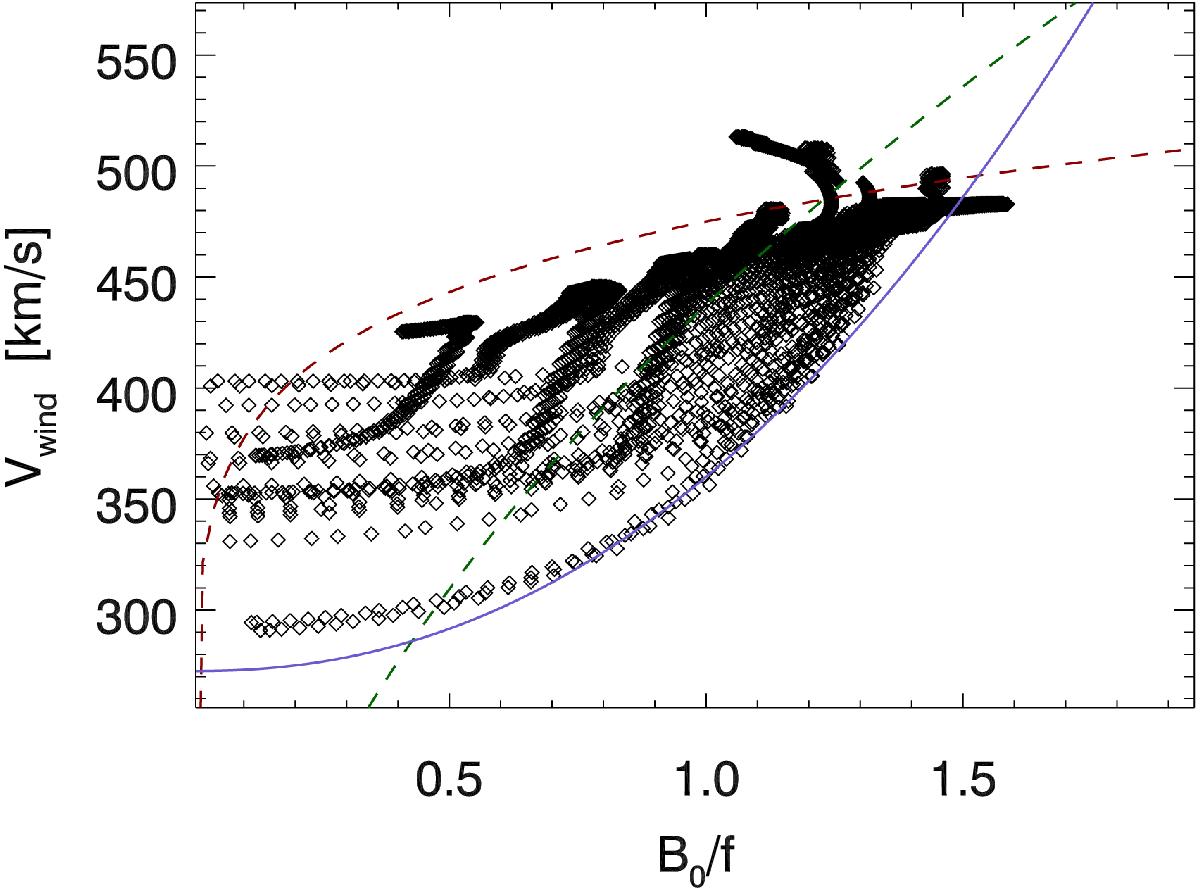
Terminal wind speed Vwind as a function of the ratio B0/ftot for the full data set. The green dashed line corresponds to the curve (B0/ftot)0.5 proposed by Suzuki (2006) normalised to an arbitrary coefficient for easier representation. The brown dashed and blue continuous lines represent the curves (B0/ftot)0.1 and (B0/ftot)2.2, which are empirical fits to the upper and lower envelopes of the data points (correspondingly, fast and slow wind limits; the curves are also normalised to arbitrary coefficients).
Current usage metrics show cumulative count of Article Views (full-text article views including HTML views, PDF and ePub downloads, according to the available data) and Abstracts Views on Vision4Press platform.
Data correspond to usage on the plateform after 2015. The current usage metrics is available 48-96 hours after online publication and is updated daily on week days.
Initial download of the metrics may take a while.